
Understanding Group By
Group By helps you choose how you want to look at your information. For example, choosing County lets you see a separate client count for each county rather than one overall total.
Instead of seeing only one total, you can use Group By to see how that information is distributed across different groups.
For example, imagine your organization has 100 clients.
A total client count tells you that there are 100 clients.
But what if you want to know how those clients are distributed across different counties?
Group By allows you to organize the results by County.
Example: Grouping clients by County
Without a breakdown, you might see:
|
Metric |
Result |
|
Total Clients |
100 |
With Group By set to County, you might see:
|
County |
Total Clients |
|
County A |
45 |
|
County B |
30 |
|
County C |
20 |
|
Not recorded |
5 |
These numbers are examples only.
Both examples use the same metric, Total Clients. The second example shows how the total is distributed across county categories.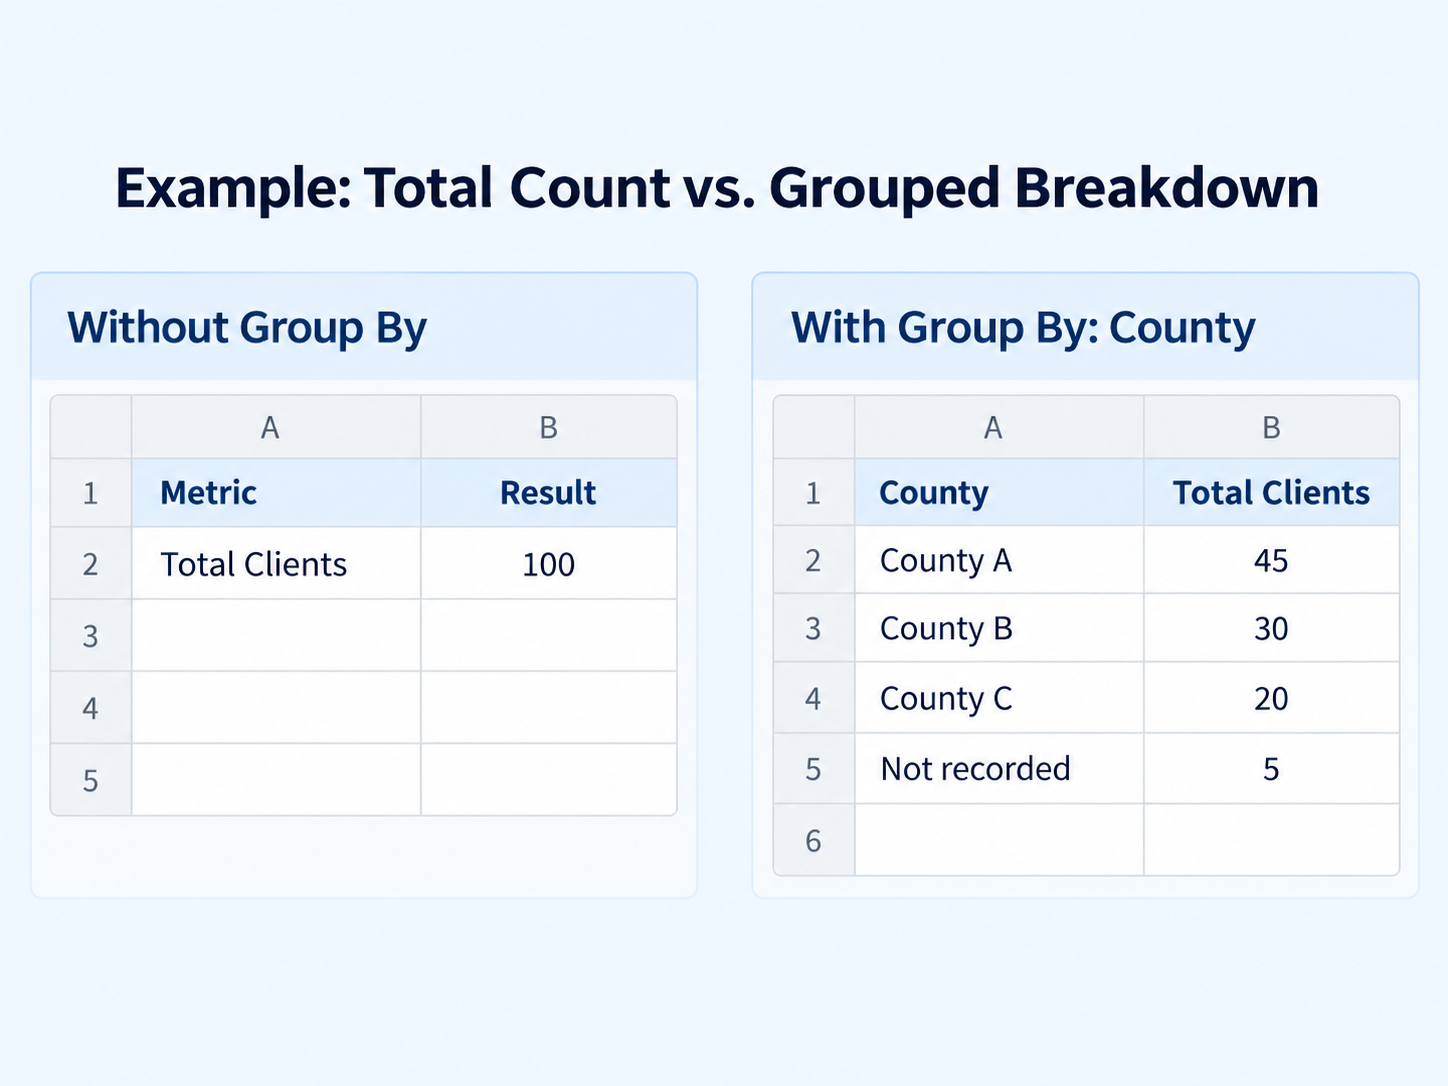
What can I group my reports by?
The available Group By options depend on your selected dataset.
|
Dataset |
Example Group By options |
|
Clients |
Gender, County, Client Status, Age Range, Assignment Type |
|
Programs |
Status, Program Type, Funding Source |
|
Assistances |
Assistance Type, Program, Funding Source, Delivery Method |
Every Custom Summary Report requires one Group By selection. The example showing a single overall total is for comparison only; the report setup itself requires you to choose how results are grouped.
How to create a report using Group By
Let's create a report showing how many clients are recorded in each county.
Step 1: Open Reports Home
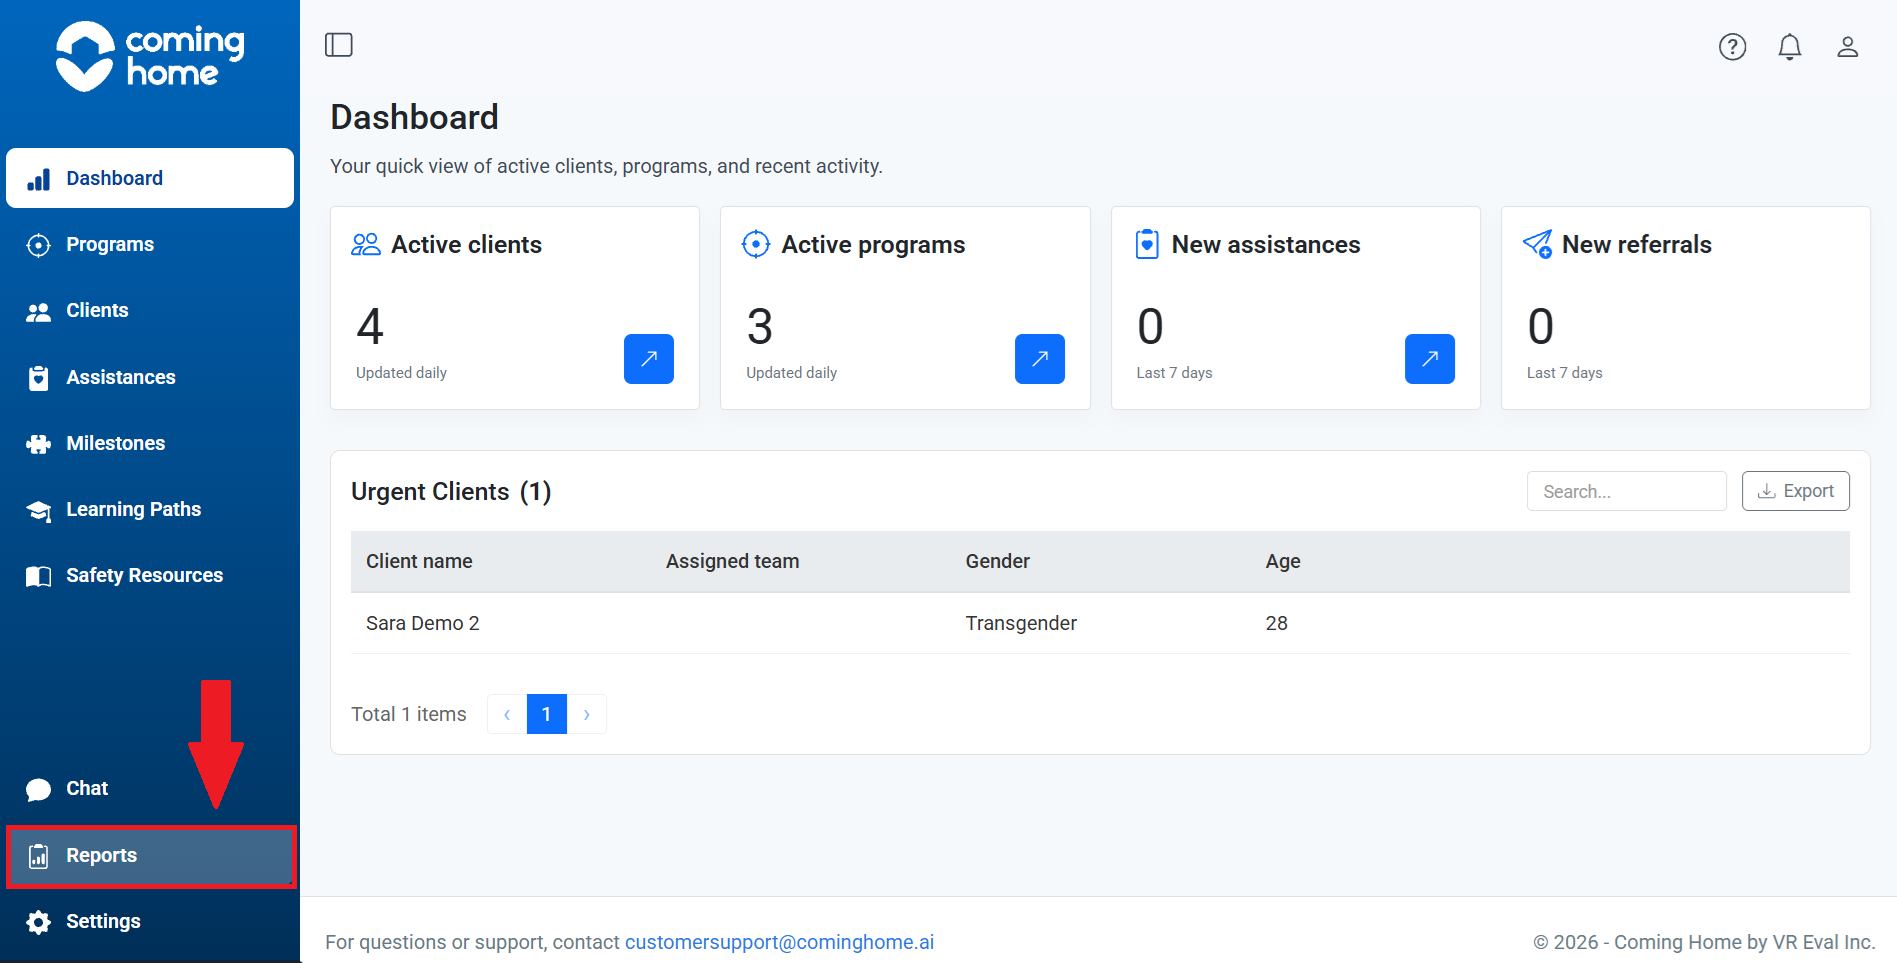
- Select Reports from the left-hand navigation menu to open the place where reports are created and saved.
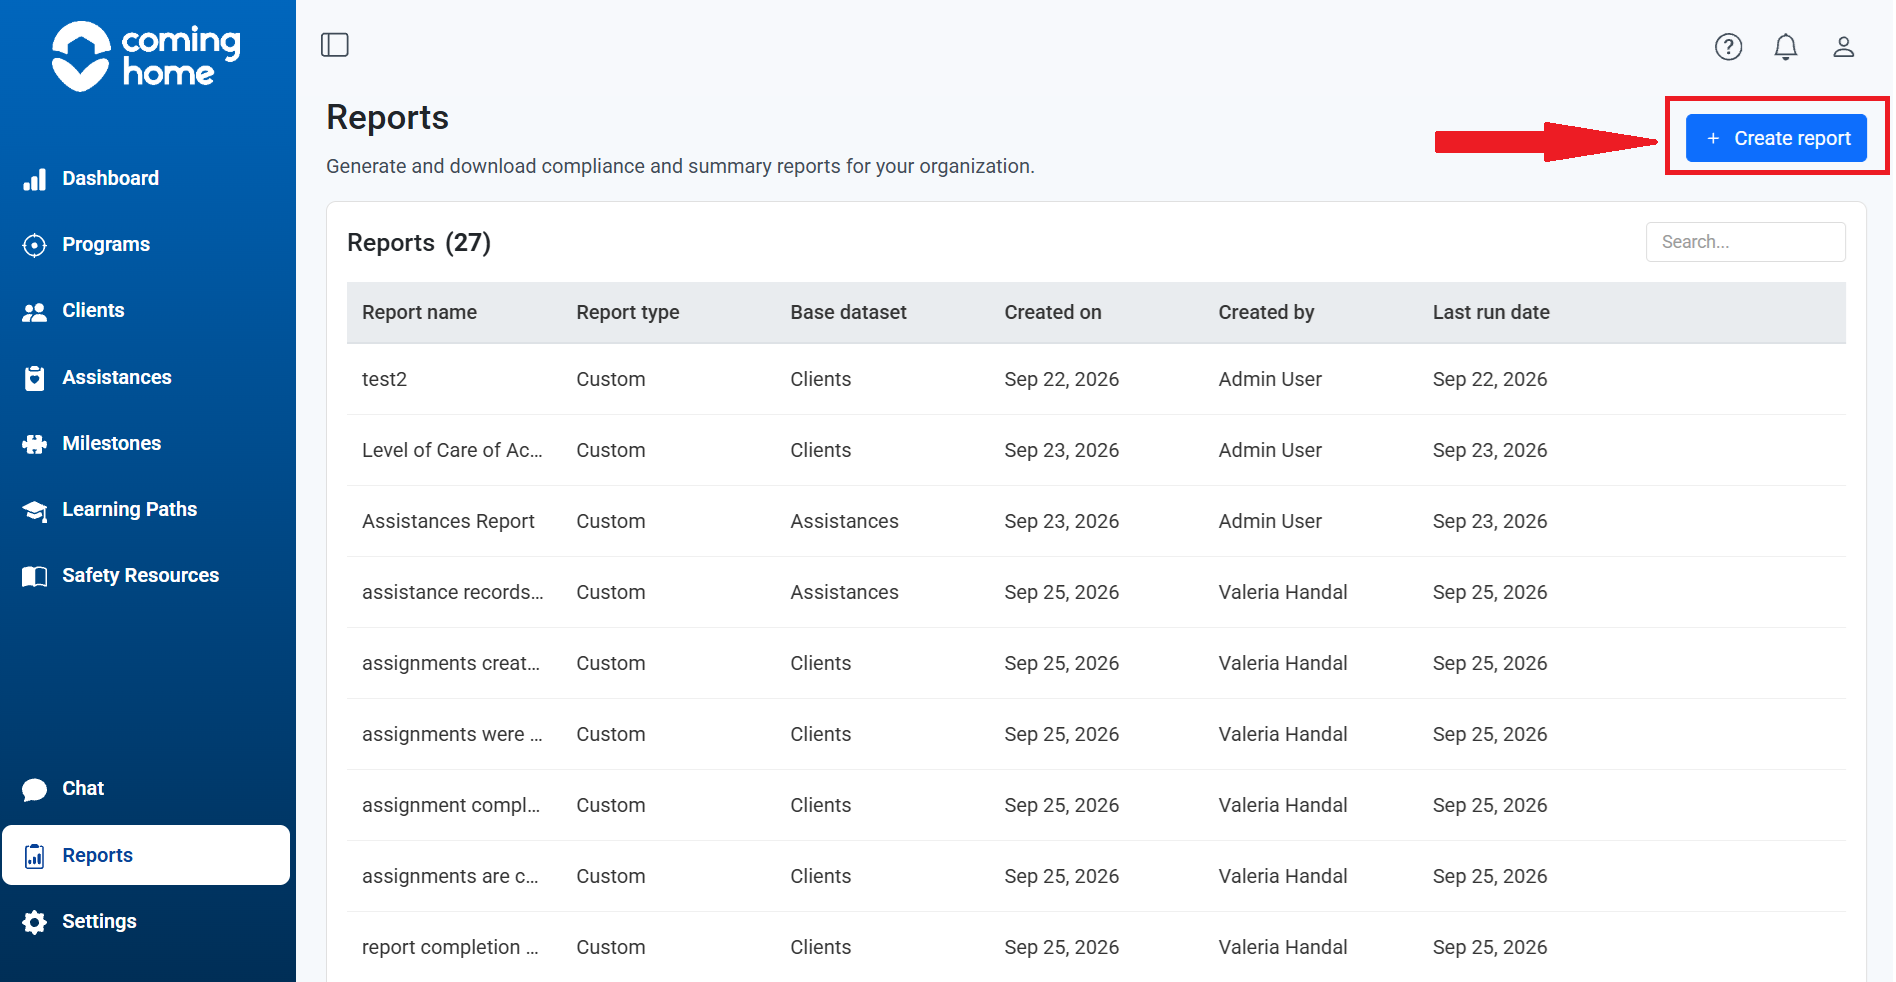
- Click Create report.
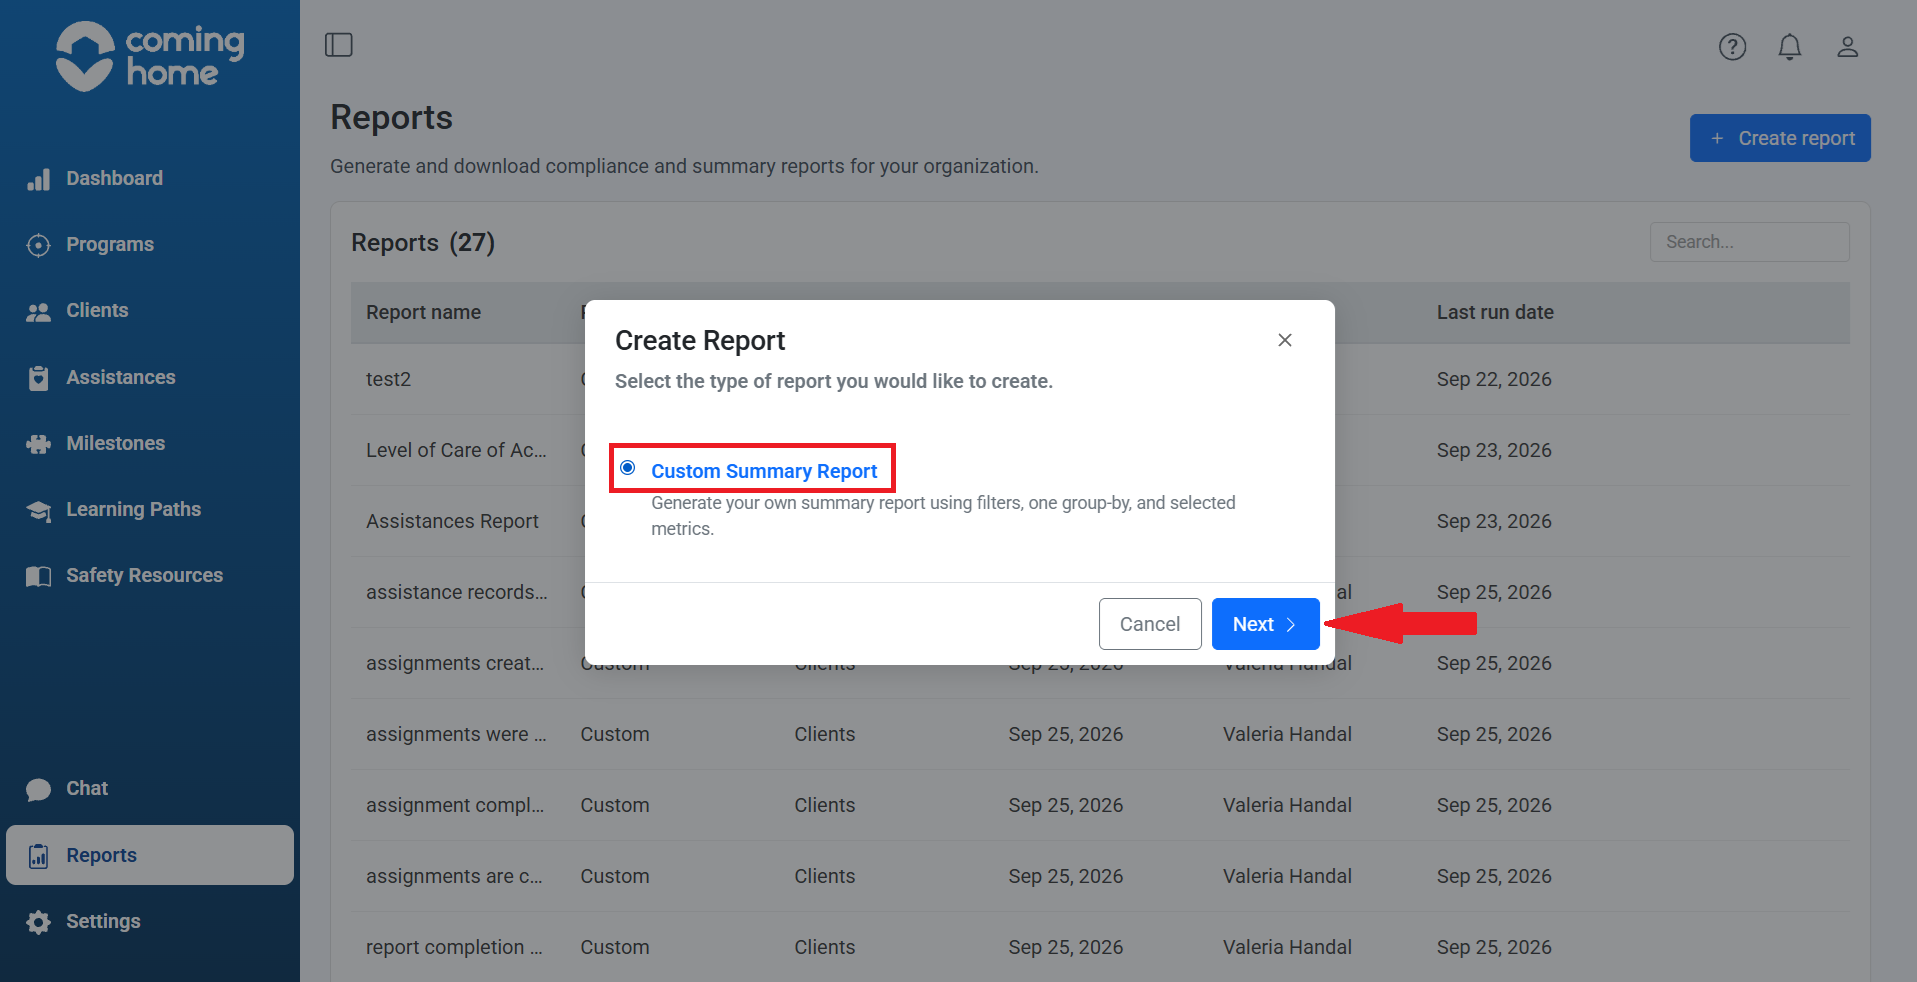
- Choose Custom Summary Report.
Step 2: Complete General Setup
Fill in the required fields.
Dataset: Select Clients.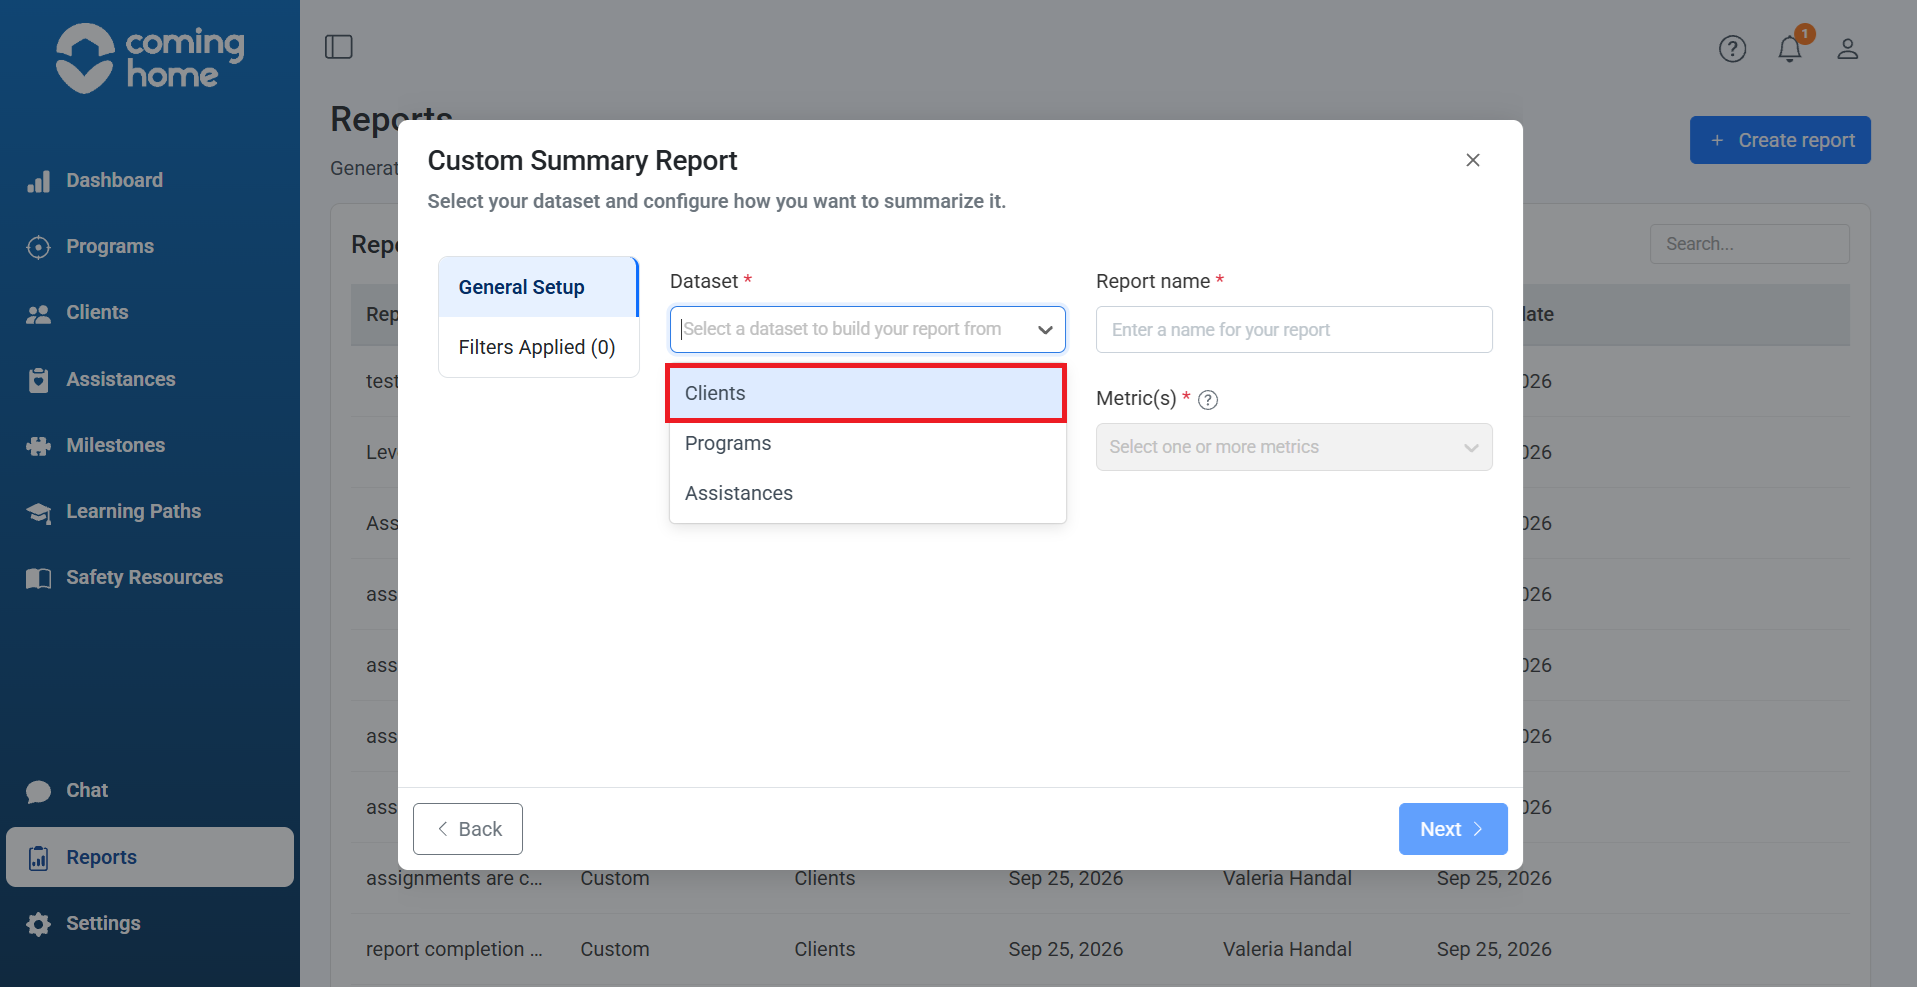
We're choosing Clients because we want to report on client information.
Report name: Enter the name that best describes your report (Example: Clients by County).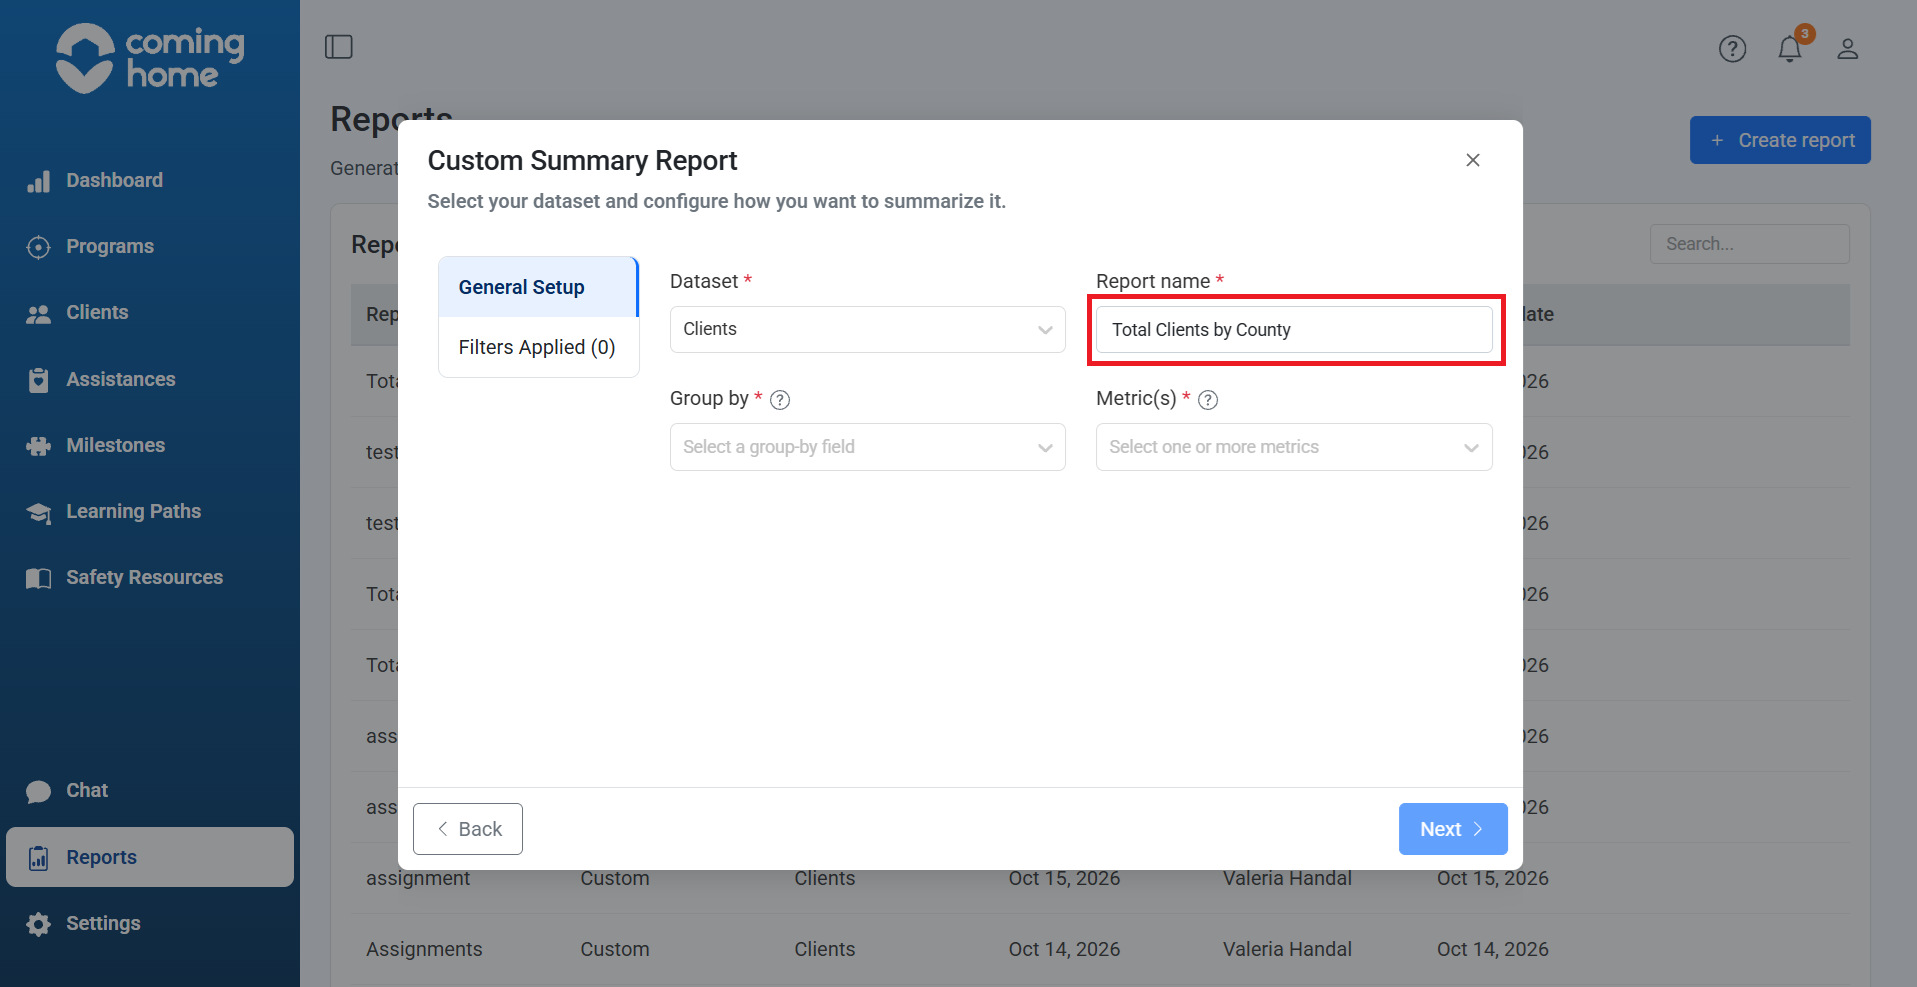
Group by: Select County.
This tells Coming Home to organize the results according to the county recorded for each client.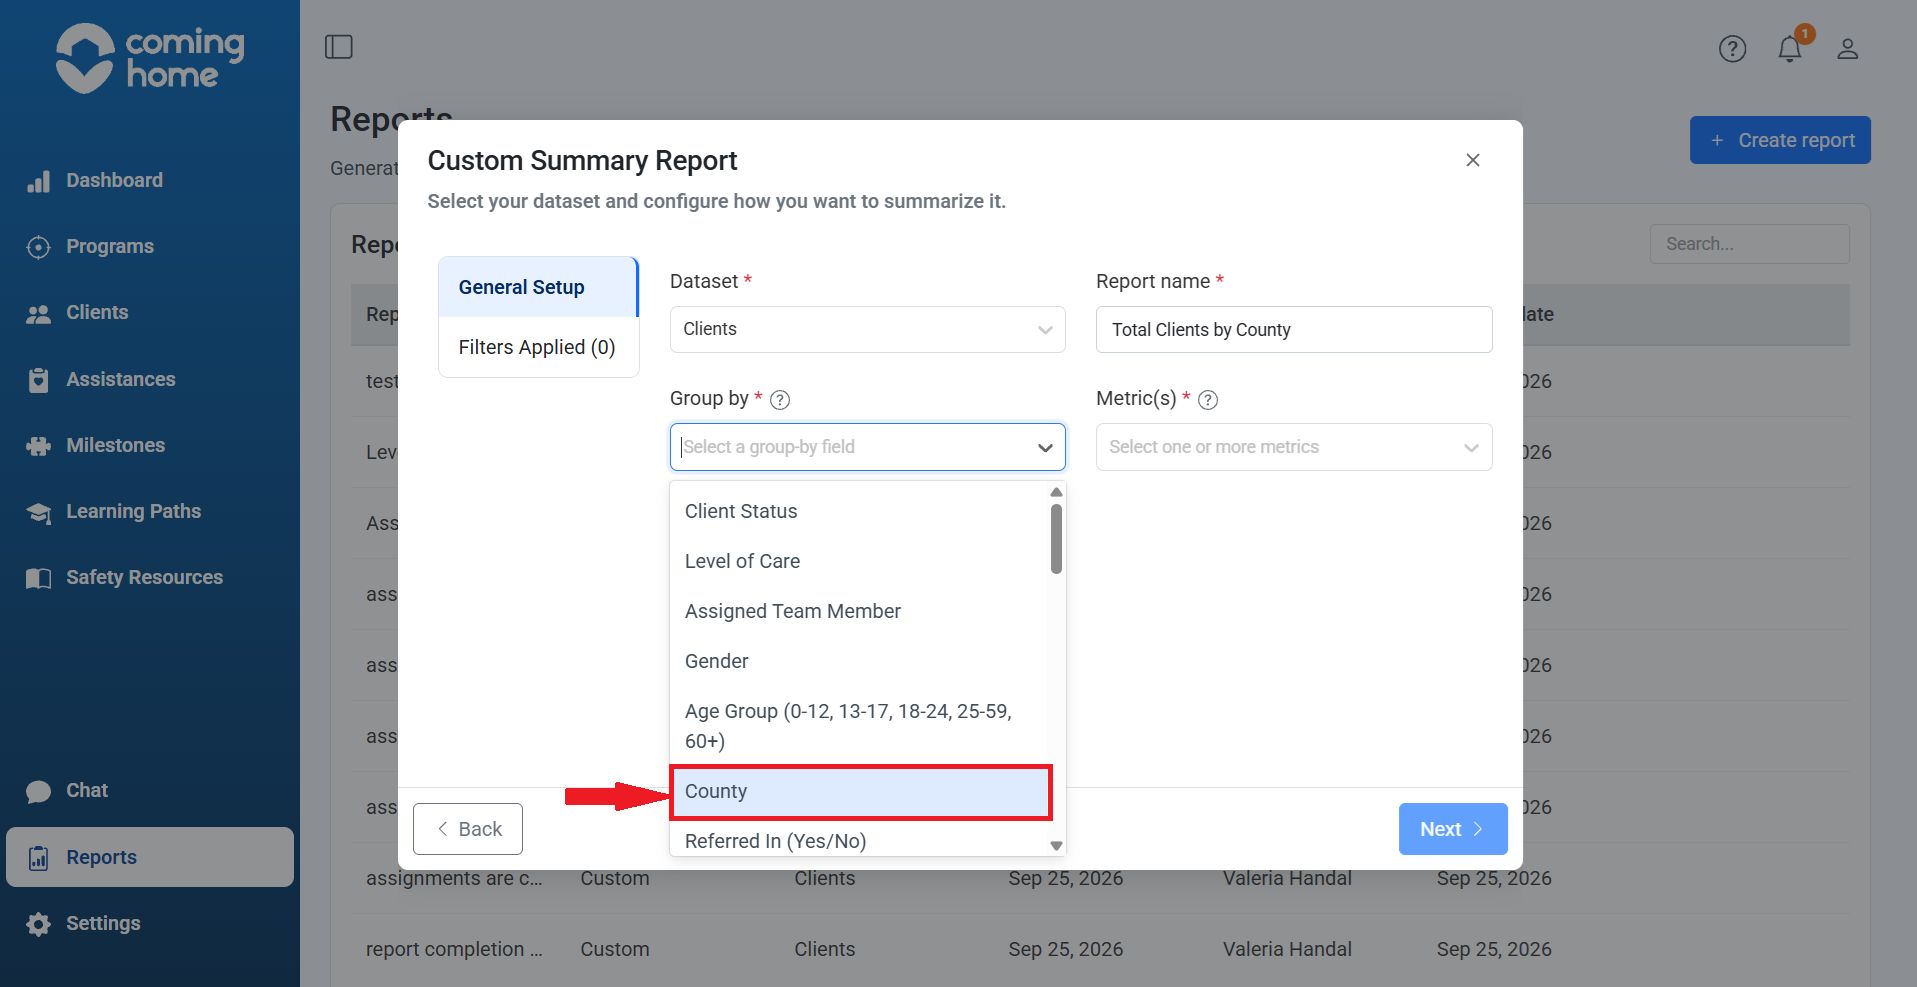
Metric(s): Select Total Clients.
This calculates the number of matching client records in each county.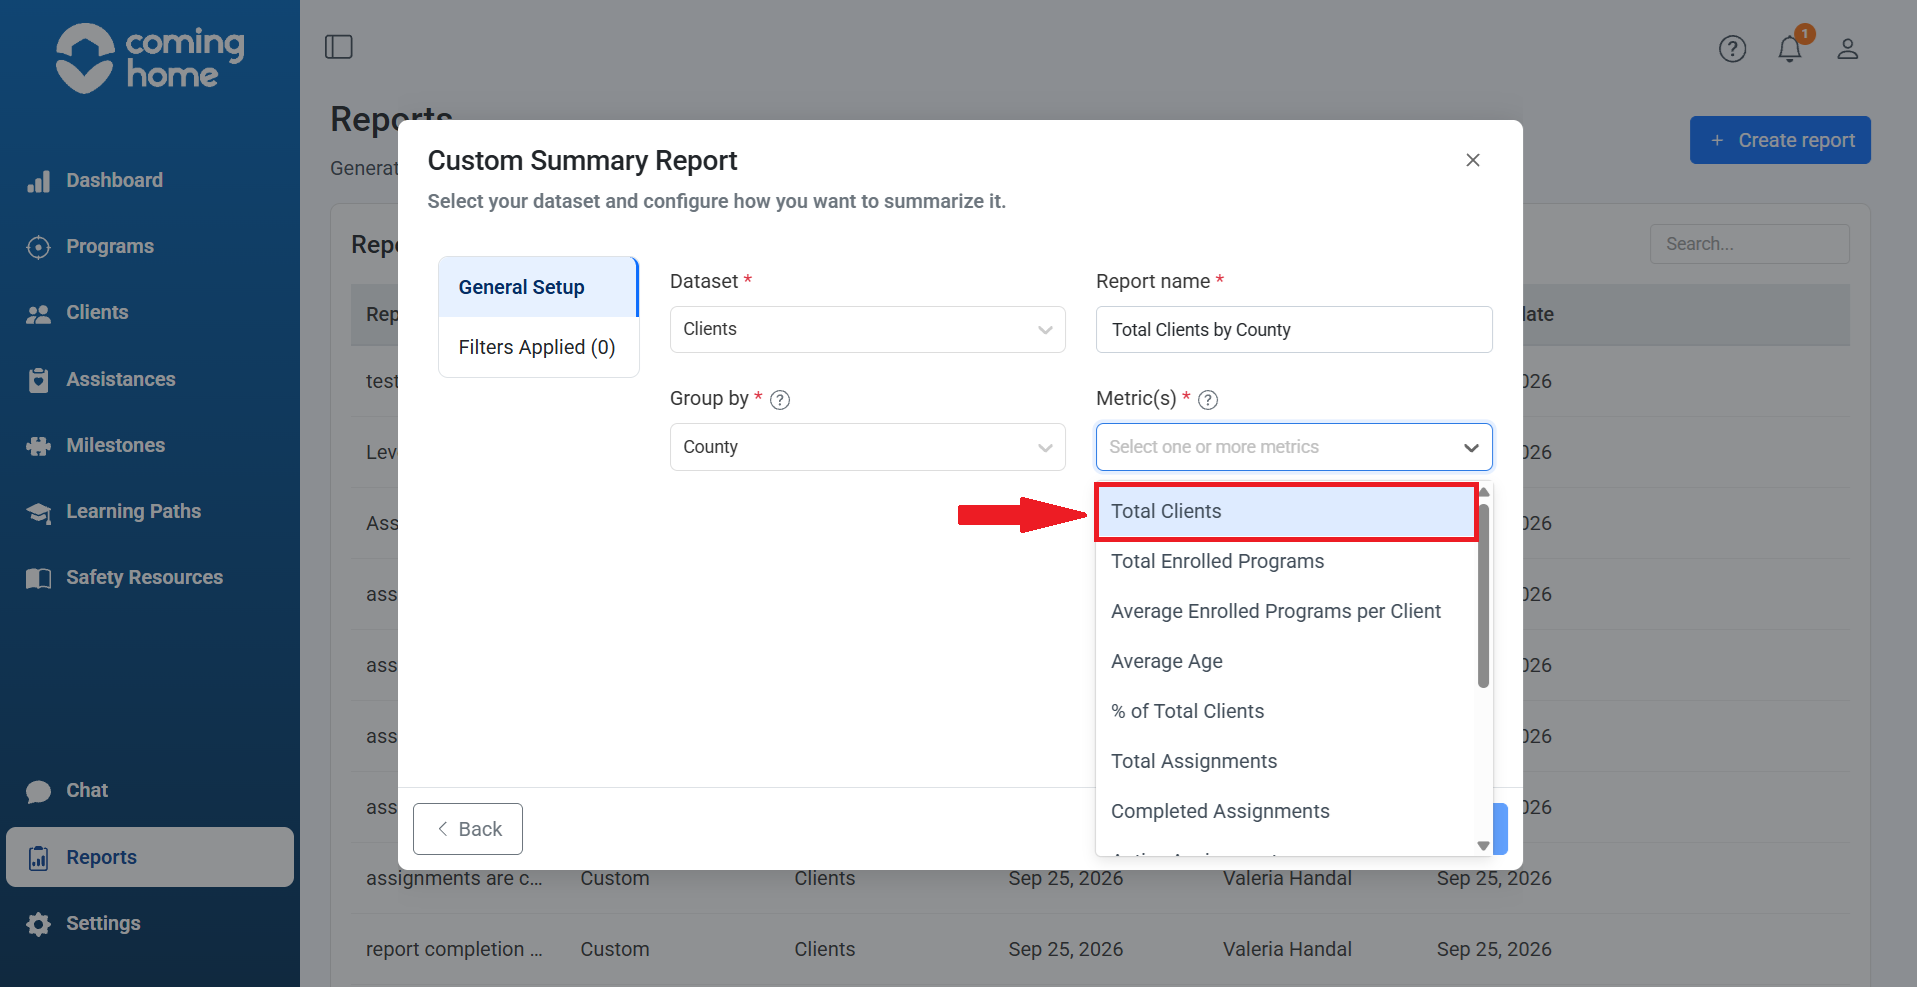
Once all four fields are complete, click Next.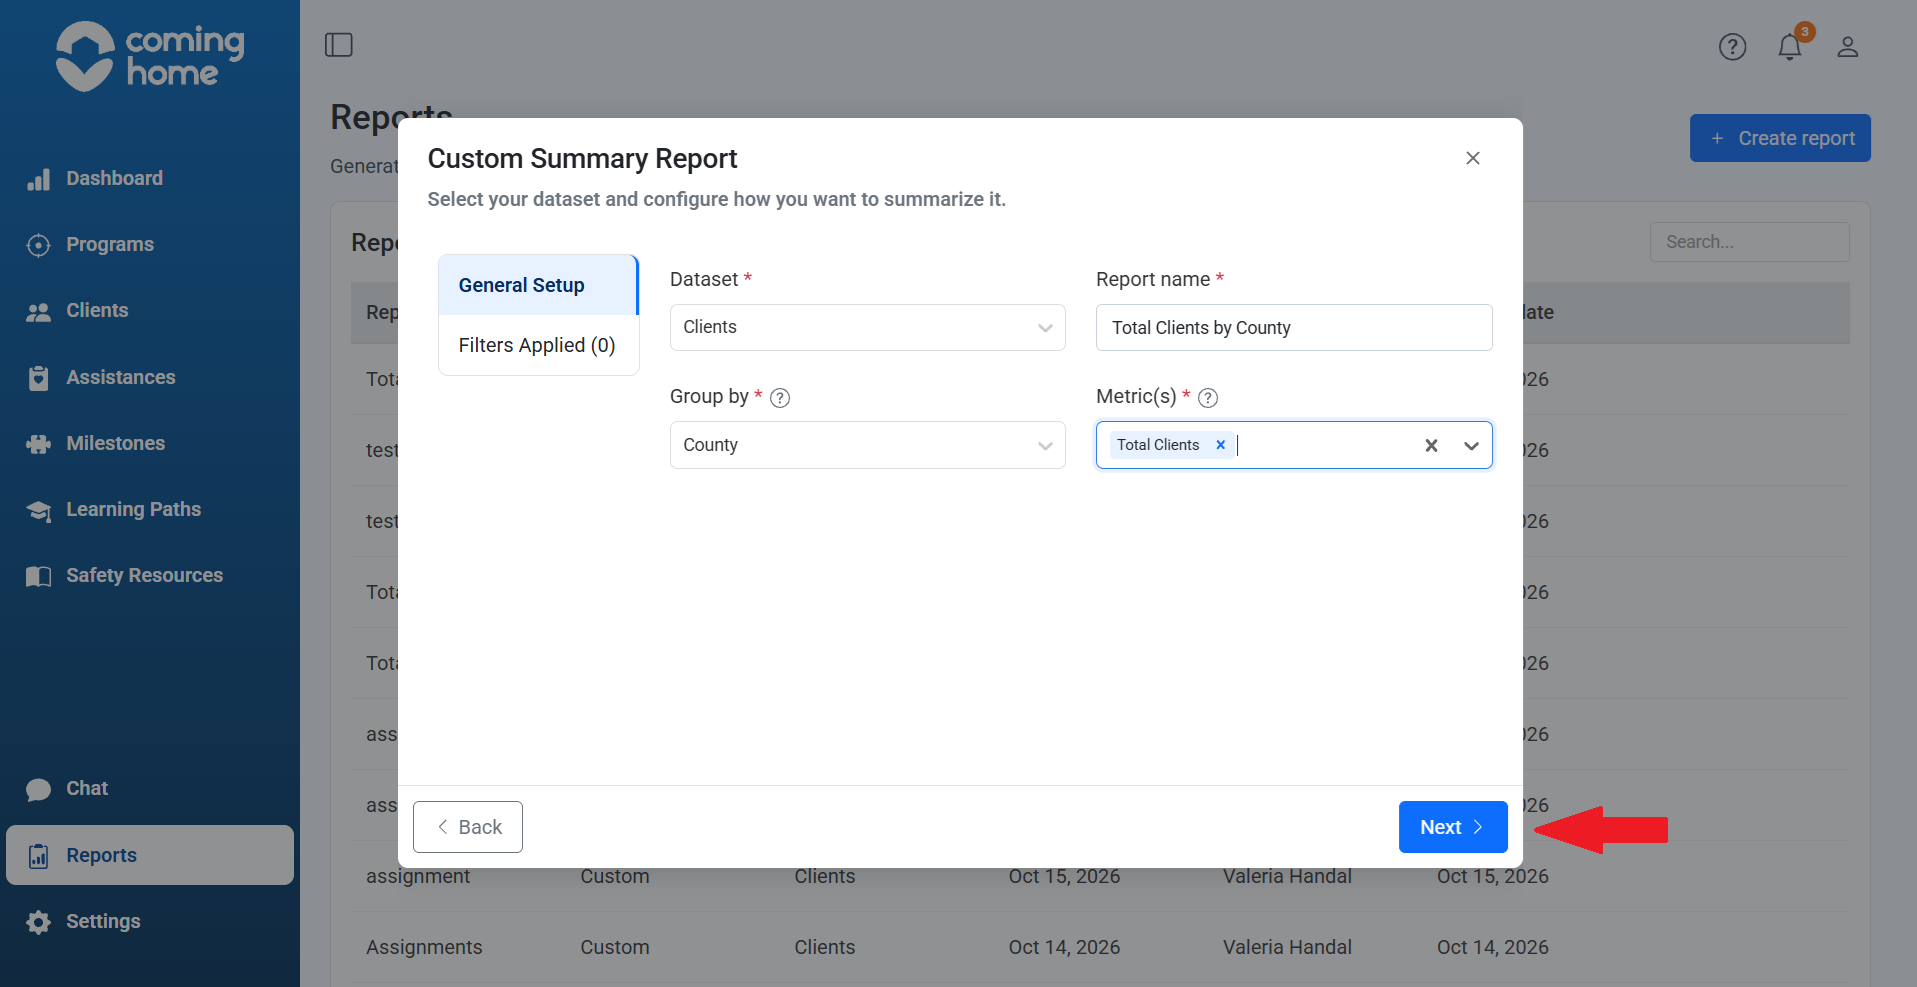
Step 3: Configure Filters Applied
The next screen is Filters Applied.
For this example, we want our report to include all of our Clients, so we'll leave the Filters section empty.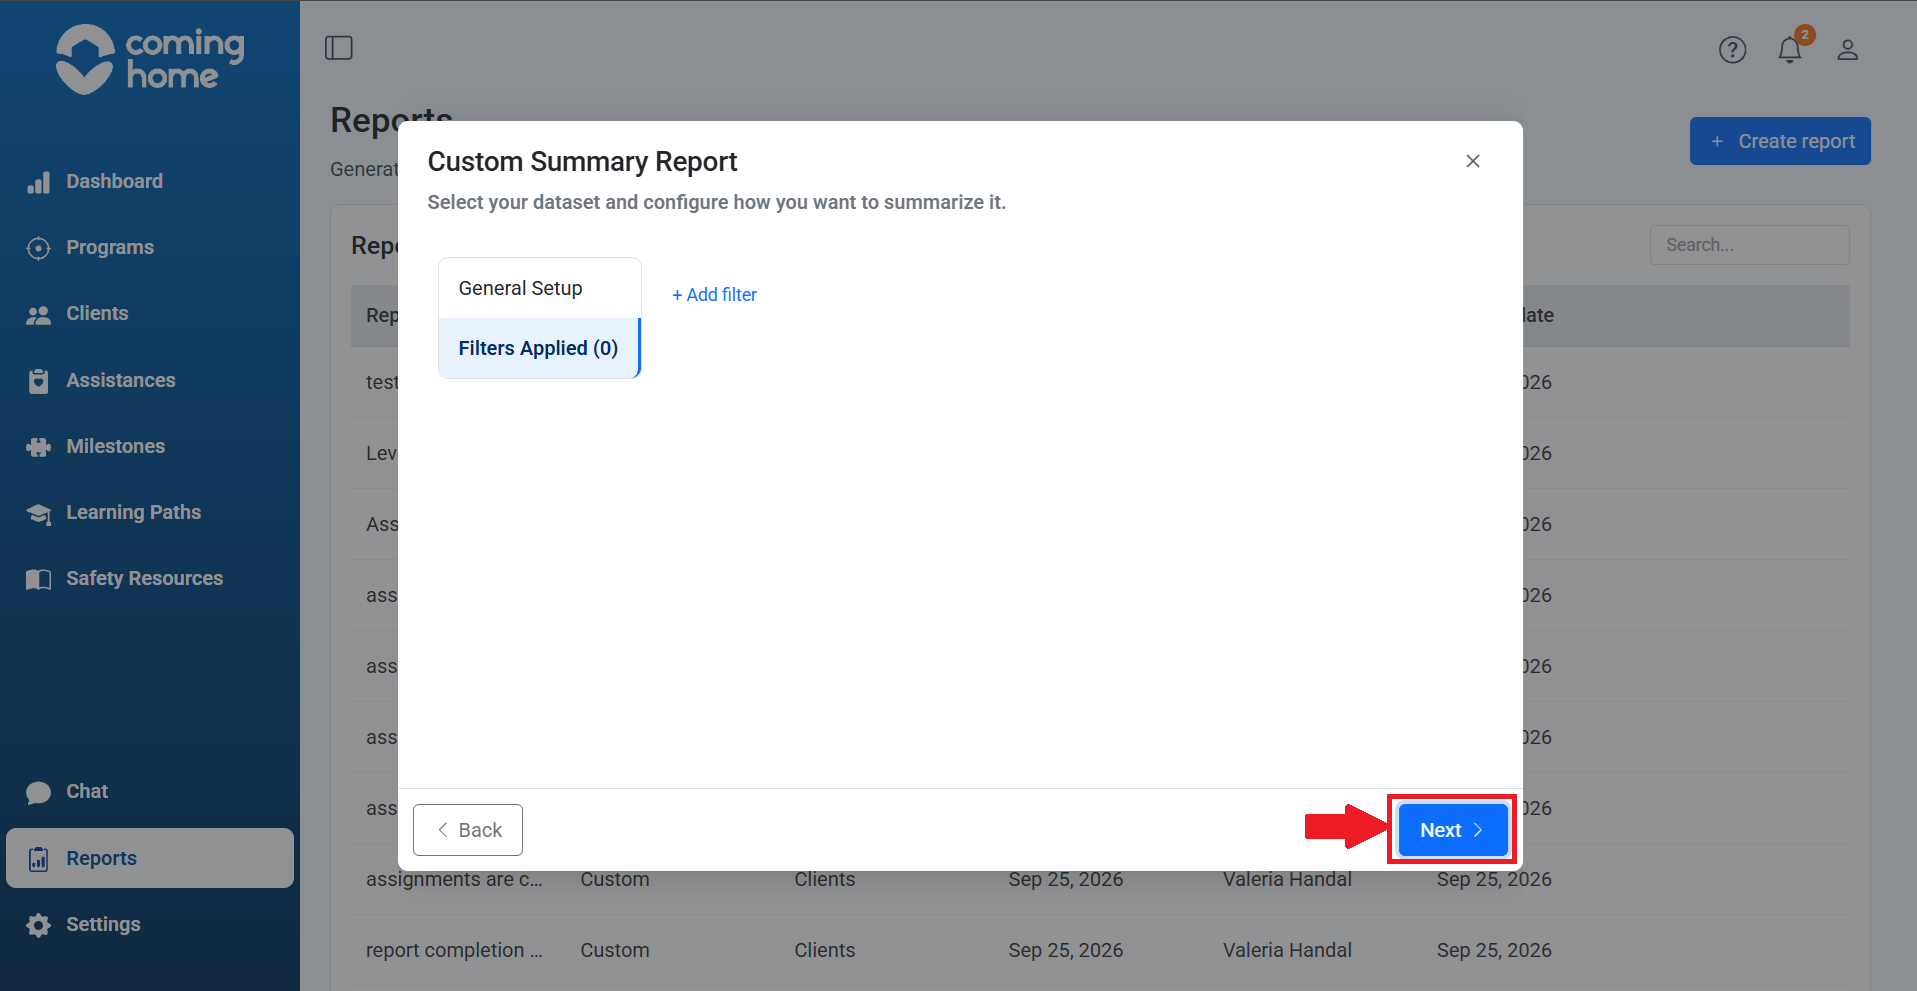
Click Next.
Step 4: Review Report Details
Confirm that the displayed information matches your selections: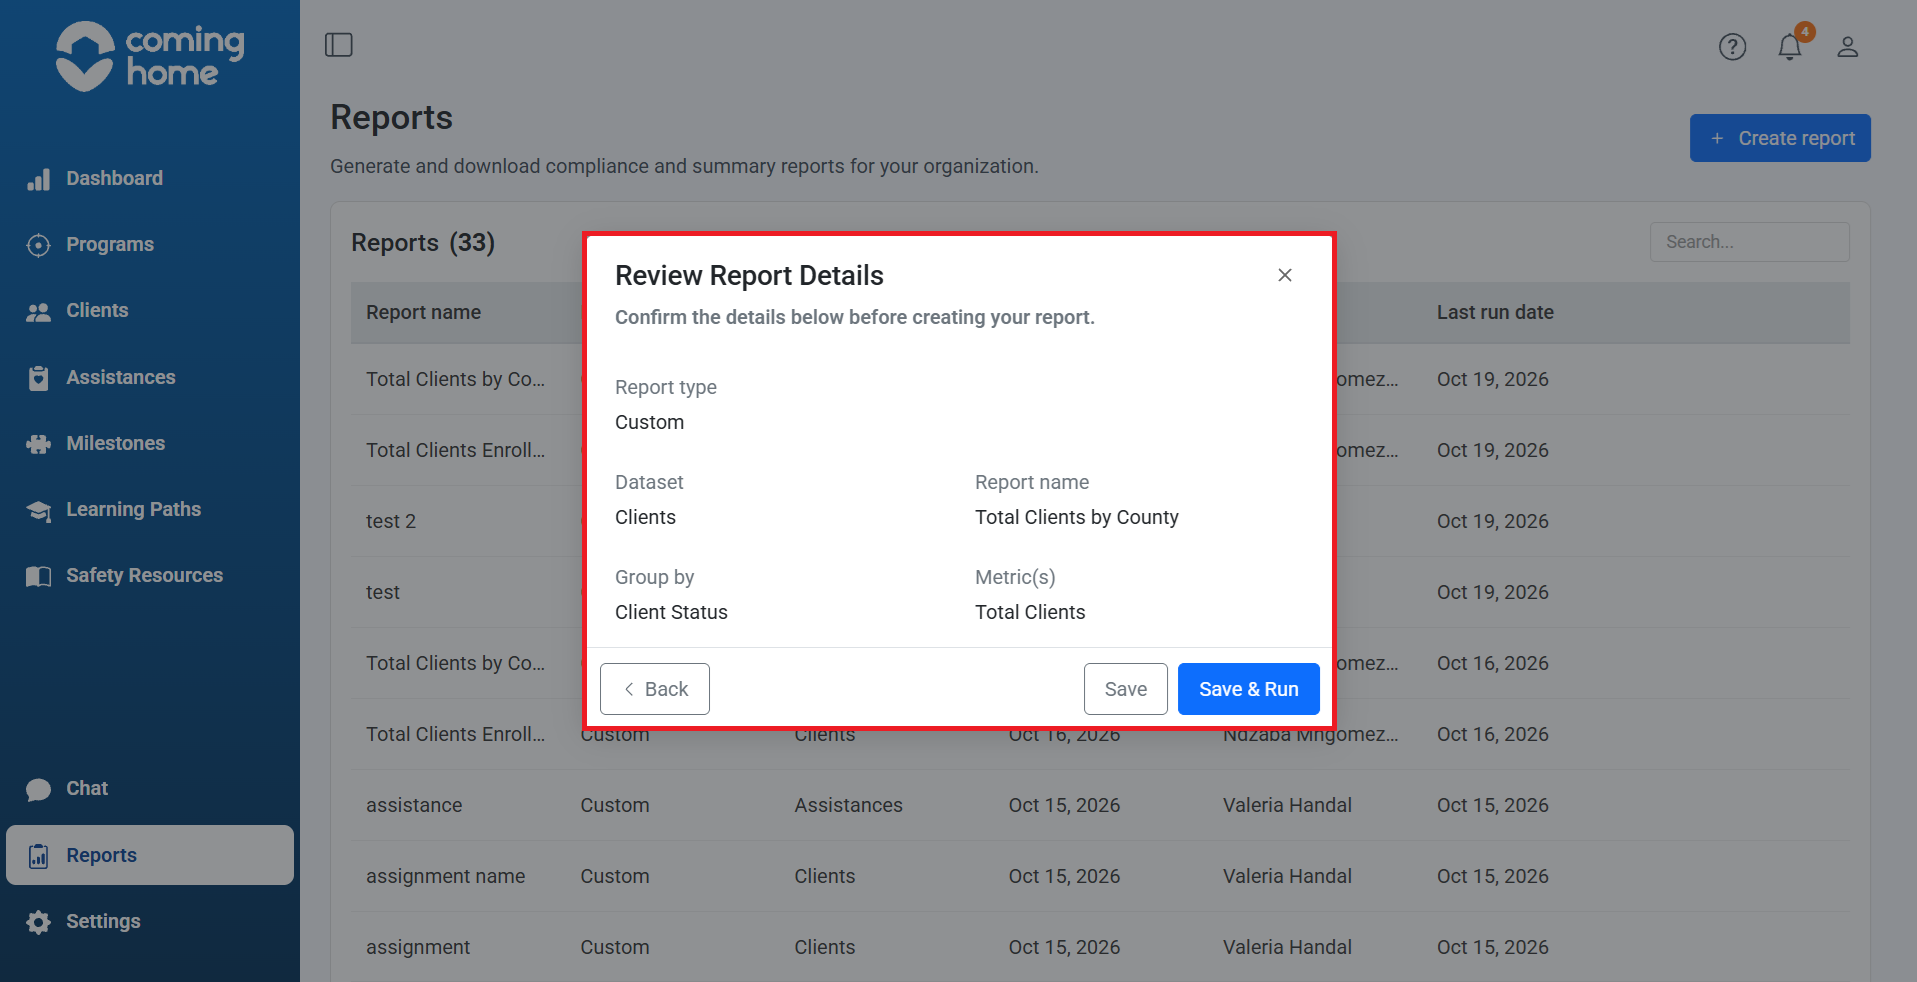
If a selection needs to be changed, click Back.
Step 5: Save & Run
Click Save & Run.
Coming Home saves the report and automatically generates the results.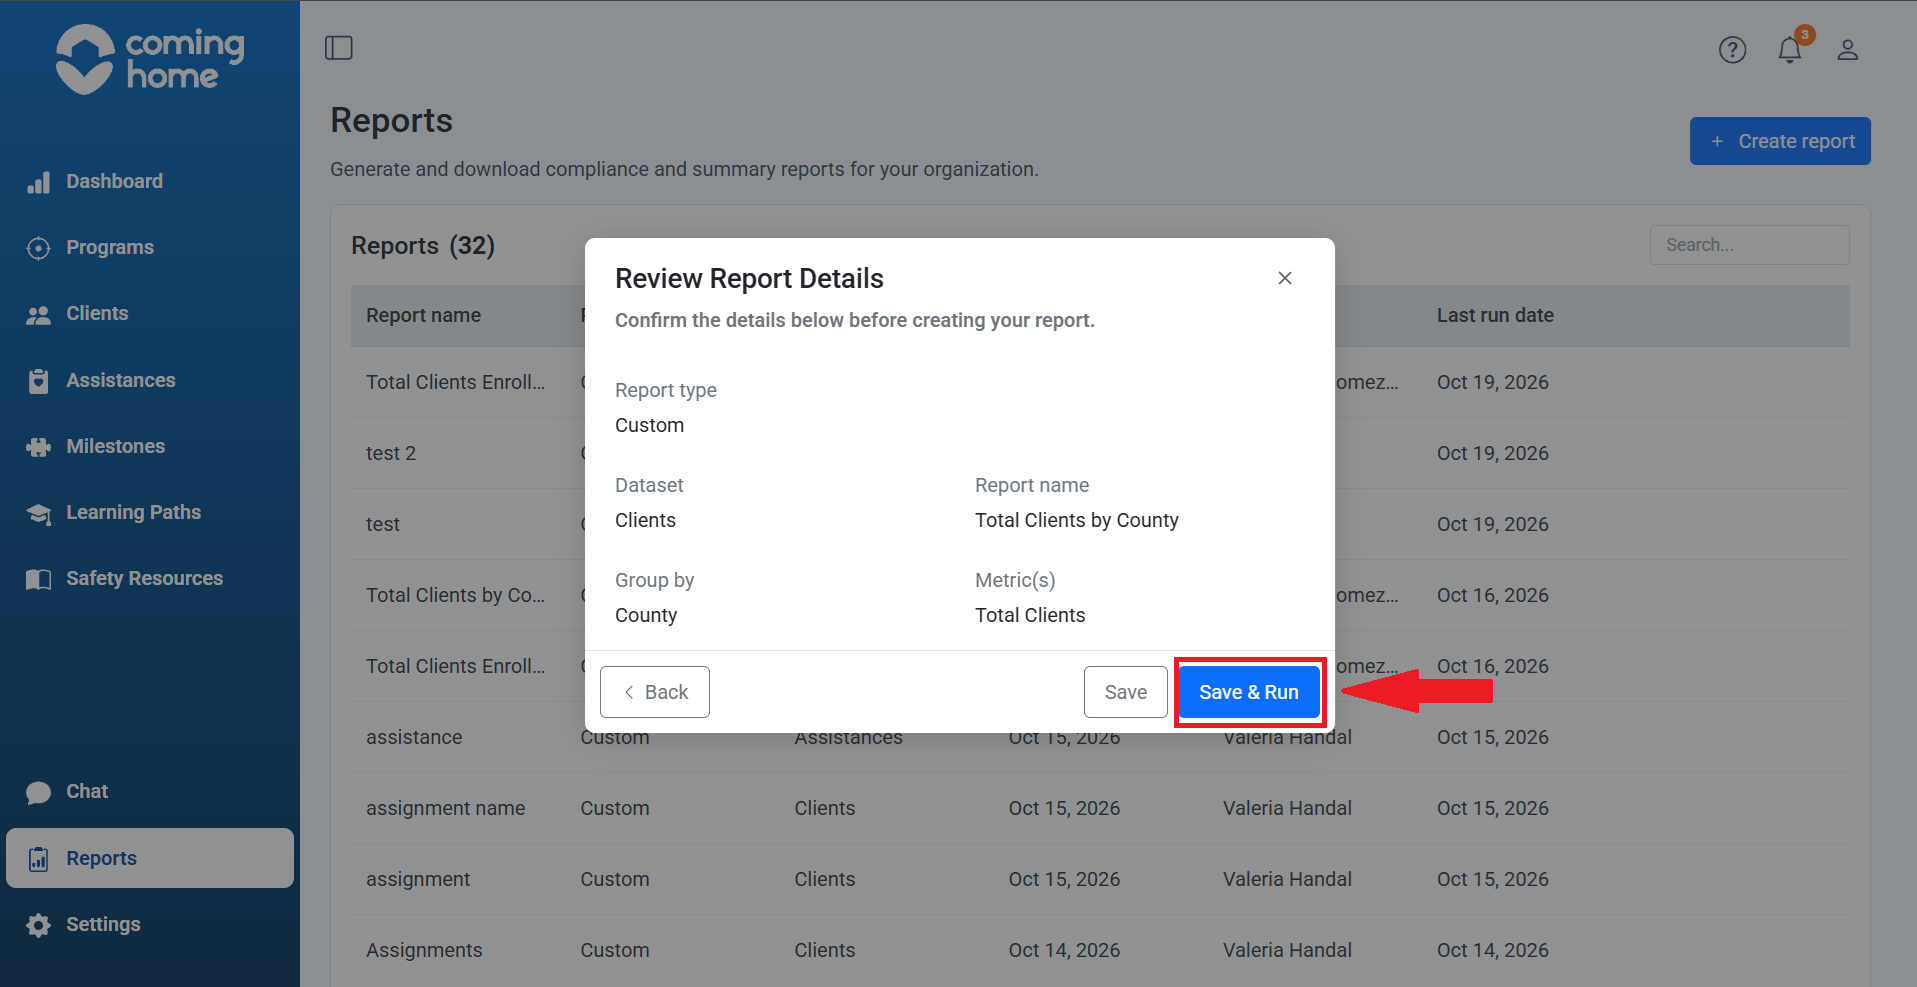
Step 6: Download your report
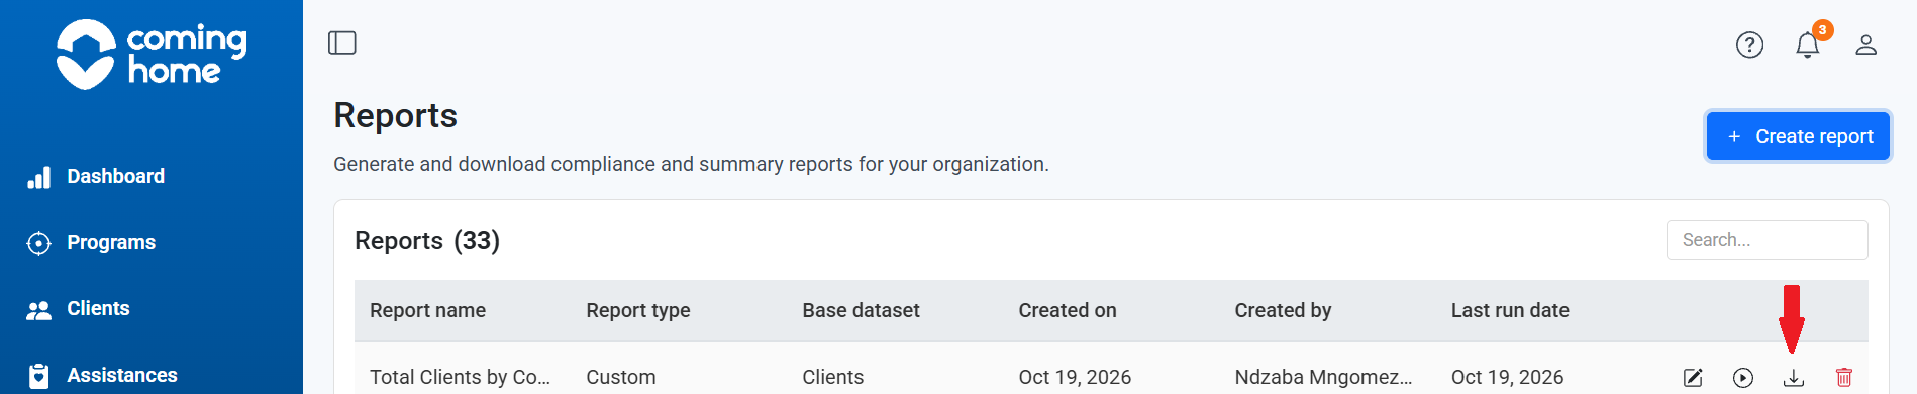
Hover your mouse cursor over your custom report to see the options menu for that report. Select  Download to retrieve the generated CSV file. The file will be downloaded to the Downloads folder on your computer, or wherever your browser downloads files by default.
Open the file to review the number of matching clients recorded in each county.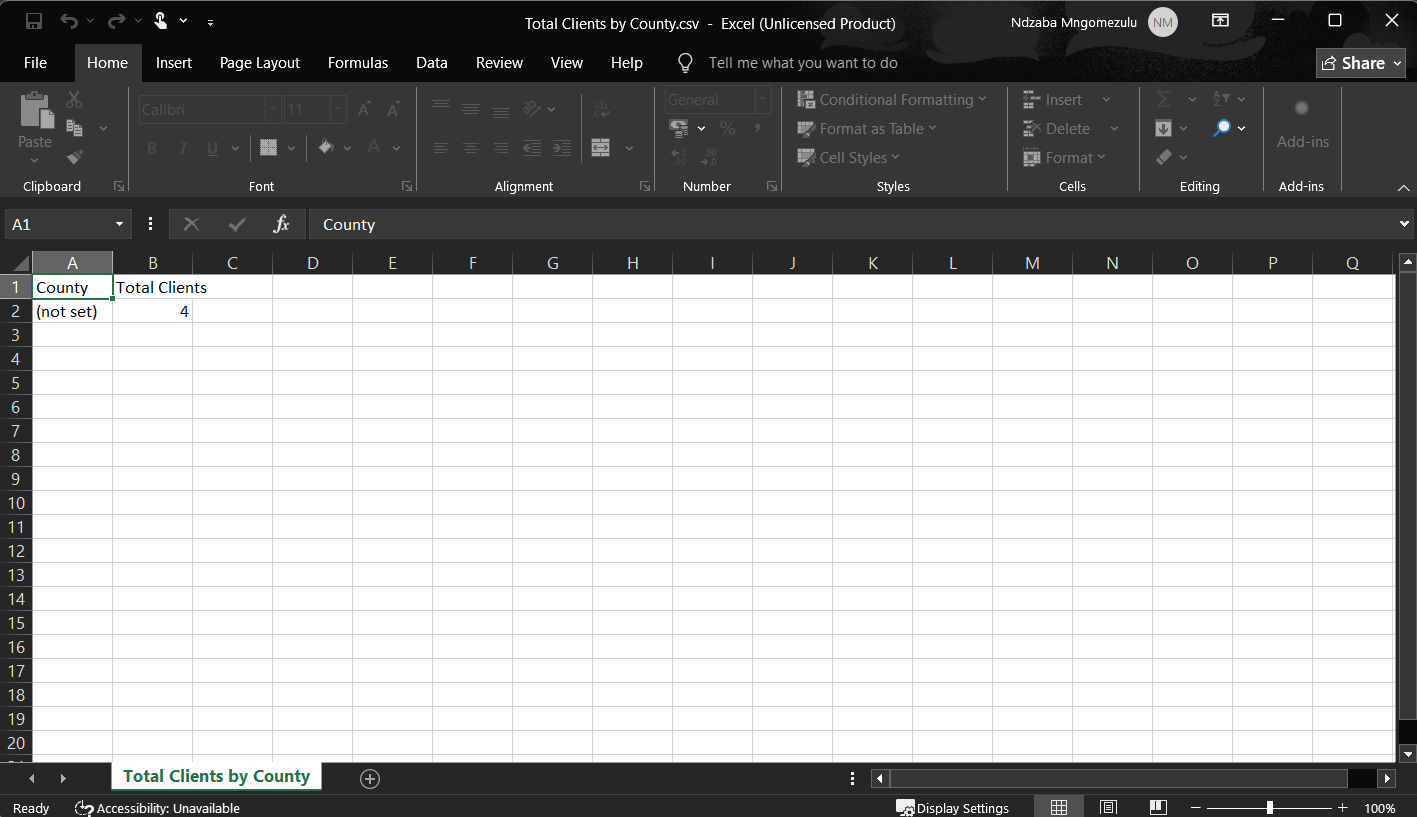
What happens when information is missing?
If a record does not have a value for the selected Group By field, Coming Home displays it as Not recorded.
For example, if five clients do not have a county recorded, those clients can appear as not set.
These records are still included in relevant totals and percentages.
How is Group By different from Filters?
Group By and Filters serve different purposes.
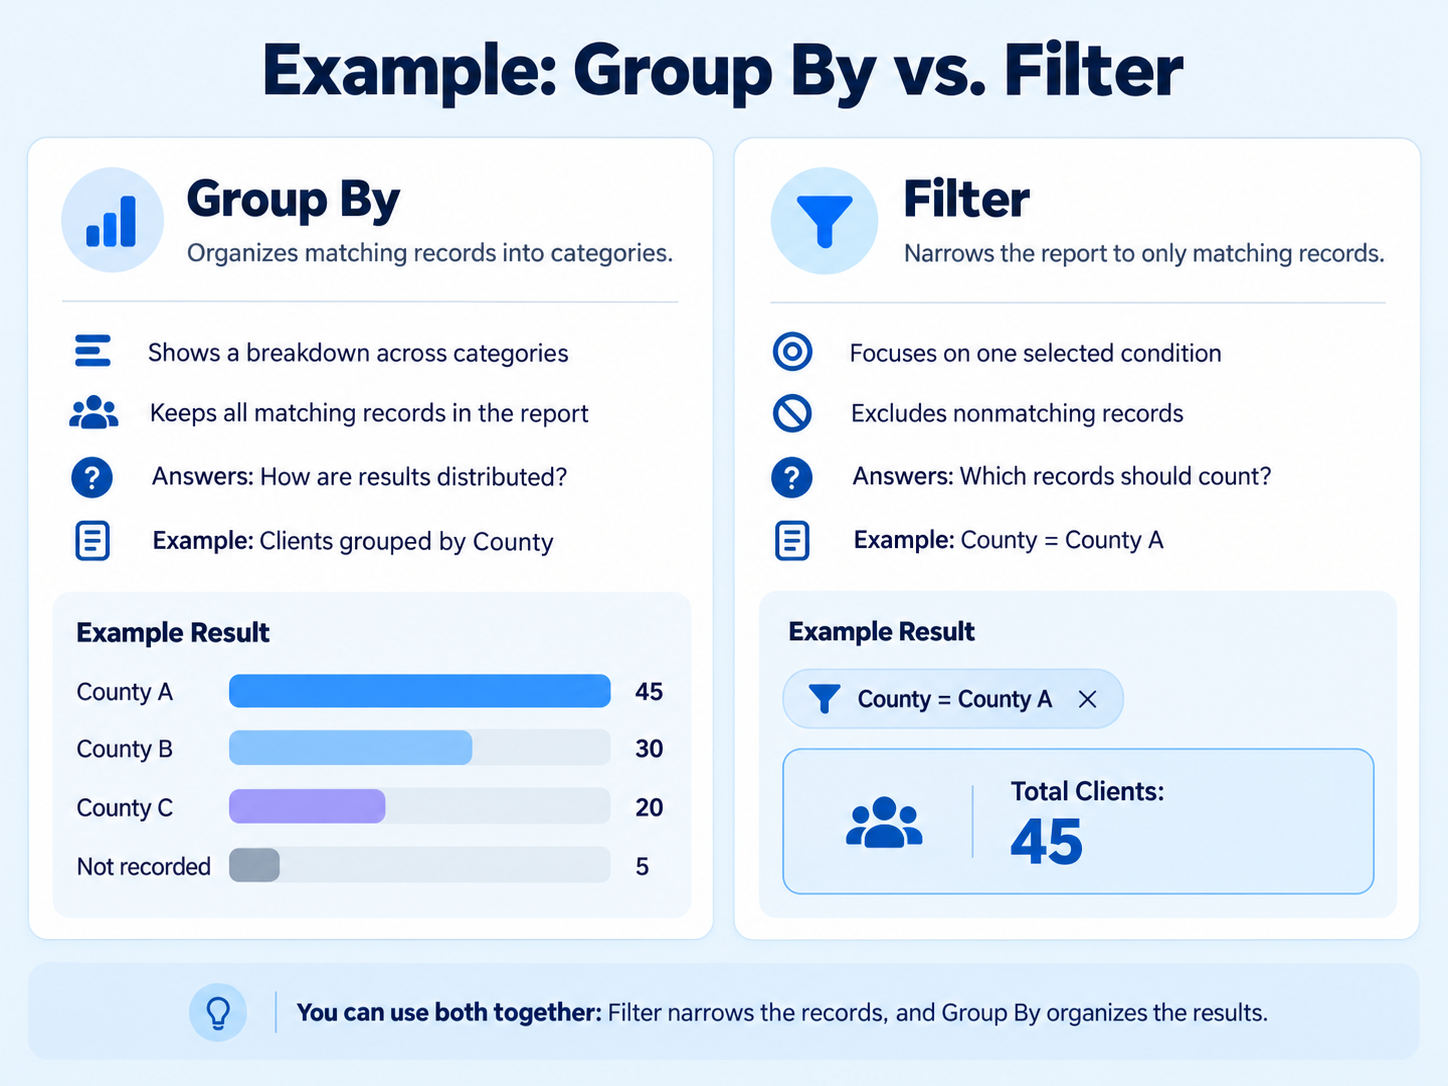
Group By organizes information.
For example, grouping clients by County shows a breakdown across the recorded counties.
Filters narrow information.
For example, a filter limiting records to County A would include only matching client records, if that filter is available in the selected configuration.
You can use Group By and Filters together.
What does this mean for your reporting?
Group By helps you understand how recorded information is distributed.
For example, rather than only reporting that your organization provided 300 Assistances, you can group those Assistances by type.
This helps you see which types of support were recorded most frequently.
Related Articles
- What metrics can I use in Custom Reports?
- What filters can I use in Custom Reports?
- What datasets are available in Custom Reports?