
Understanding filters
Filters help you choose which records Coming Home should include in your report. For example, imagine your supervisor asks: “How many Assistances did our Outreach Program provide during September?”
Your organization may have Assistance records from several programs across different months. Filters can focus the report on the Outreach Program and a September date range.
The Program filter answers which program to include. The Provided On date filter answers which period to include.
Filters help you answer specific questions without manually reviewing or removing records. They change which information is included in the report, not the information saved in Coming Home.
How do filters work?
Filters are configured after completing the four required fields in General Setup.
You first select:
- Dataset: The type of records your report will use.
- Report name: The name used to identify your saved report.
- Group by: How you want the results organized.
- Metric(s): The numbers you want calculated.
Once these fields are complete, click Next to open the Filters Applied section.
Click + Add filter to choose conditions that narrow the records included in your report.
What filters are available?
The filters available depend on the Dataset and other reporting selections. The examples below come from the Custom Summary Reports documentation and illustrate useful reporting questions. They are not a complete, verified list of filters in the current interface.
|
Dataset |
Documented filtering examples |
|
Clients |
Program and Assignment Type (documented examples) |
|
Programs |
Funding Source (documented example) |
|
Assistances |
Program, Assistance Type, and Provided On (documented examples) |
To view the filter options available for your current report, complete General Setup, click Next, and then select + Add filter.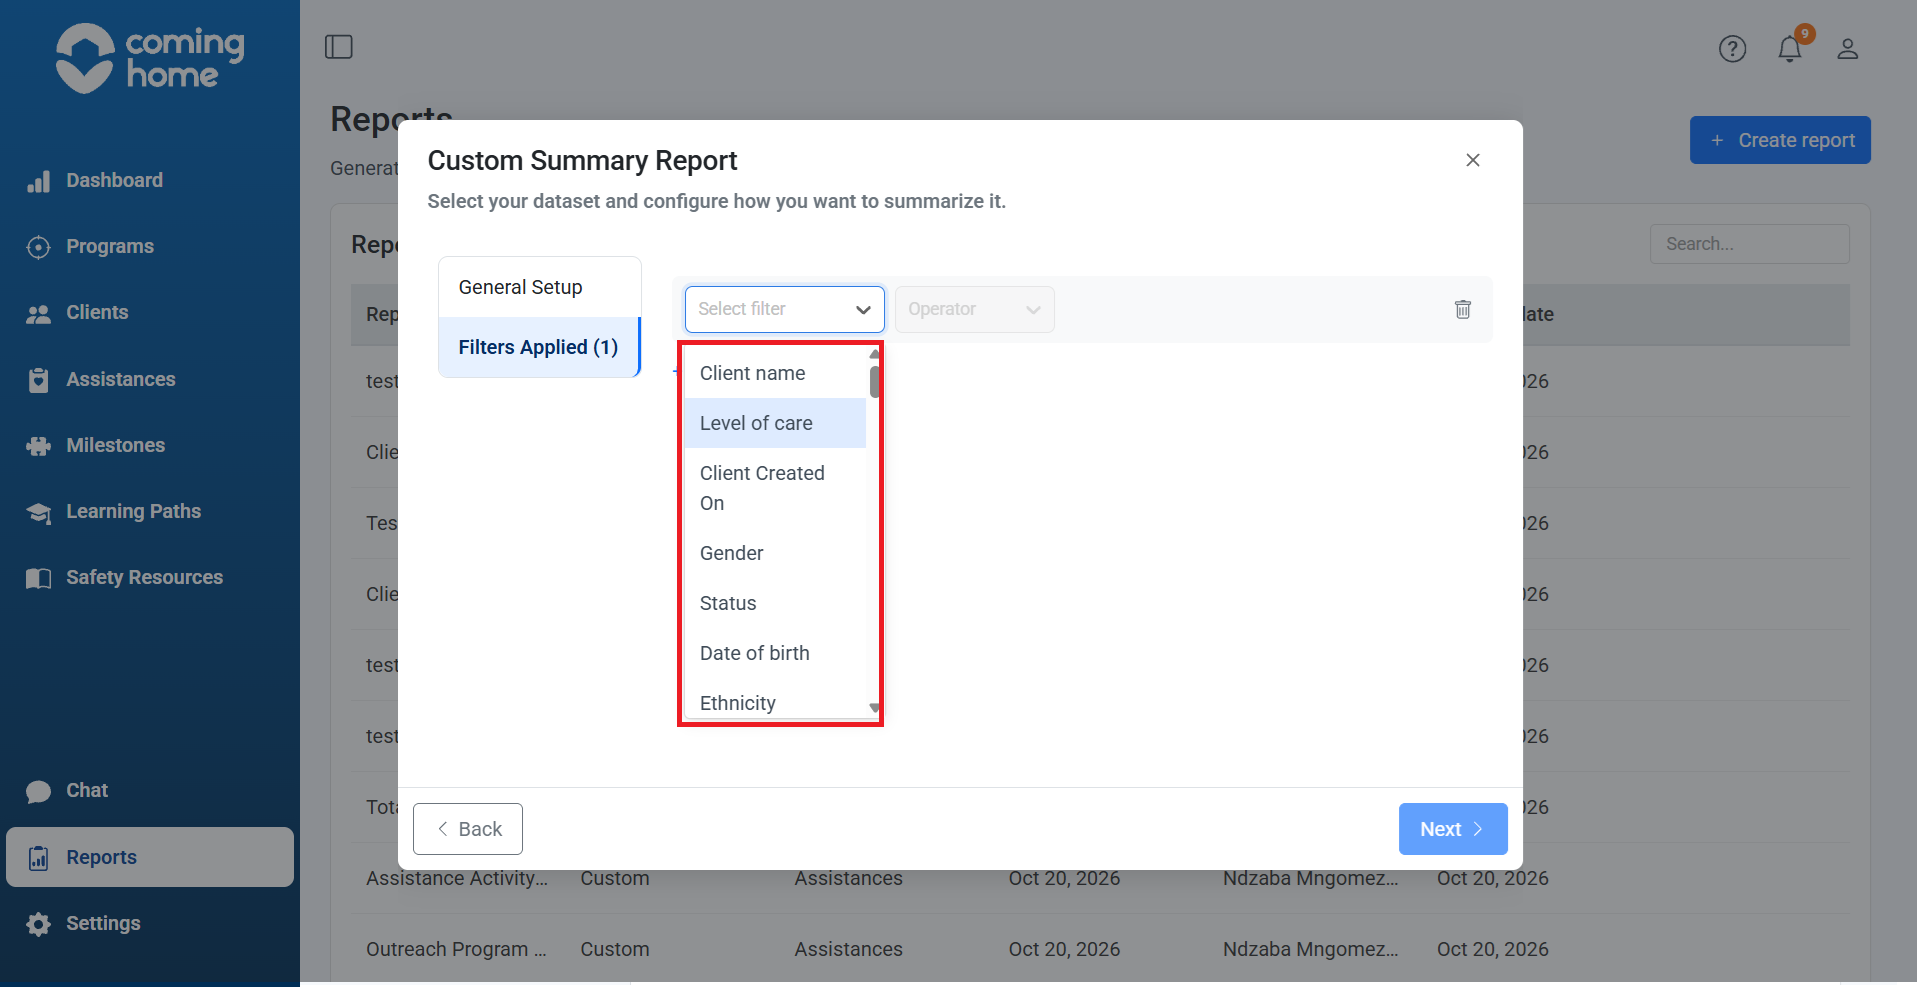
How to create a Custom Report using filters
Let's create a report that answers this question using two filters: one for the program and one for the reporting period.
“How many Assistances did our Outreach Program provide during September?”
Step 1: Open Reports Home
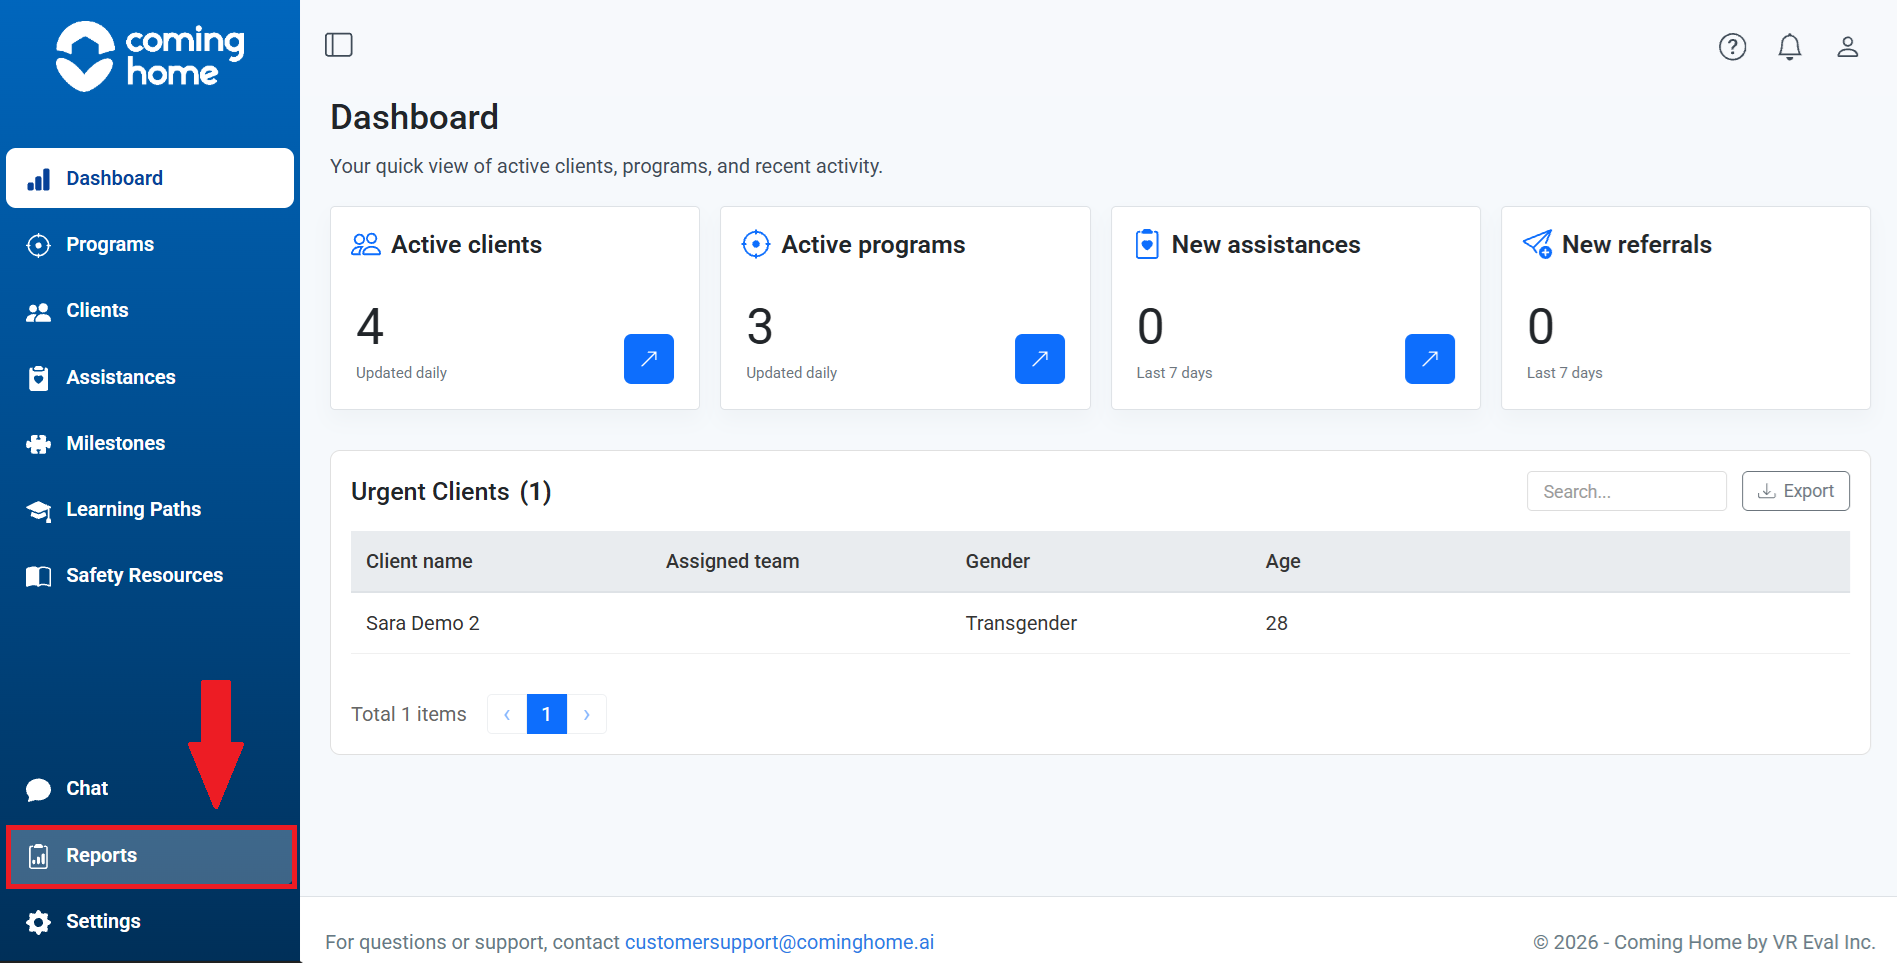
- Select Reports from the left-hand navigation menu to open the place where reports are created and saved.
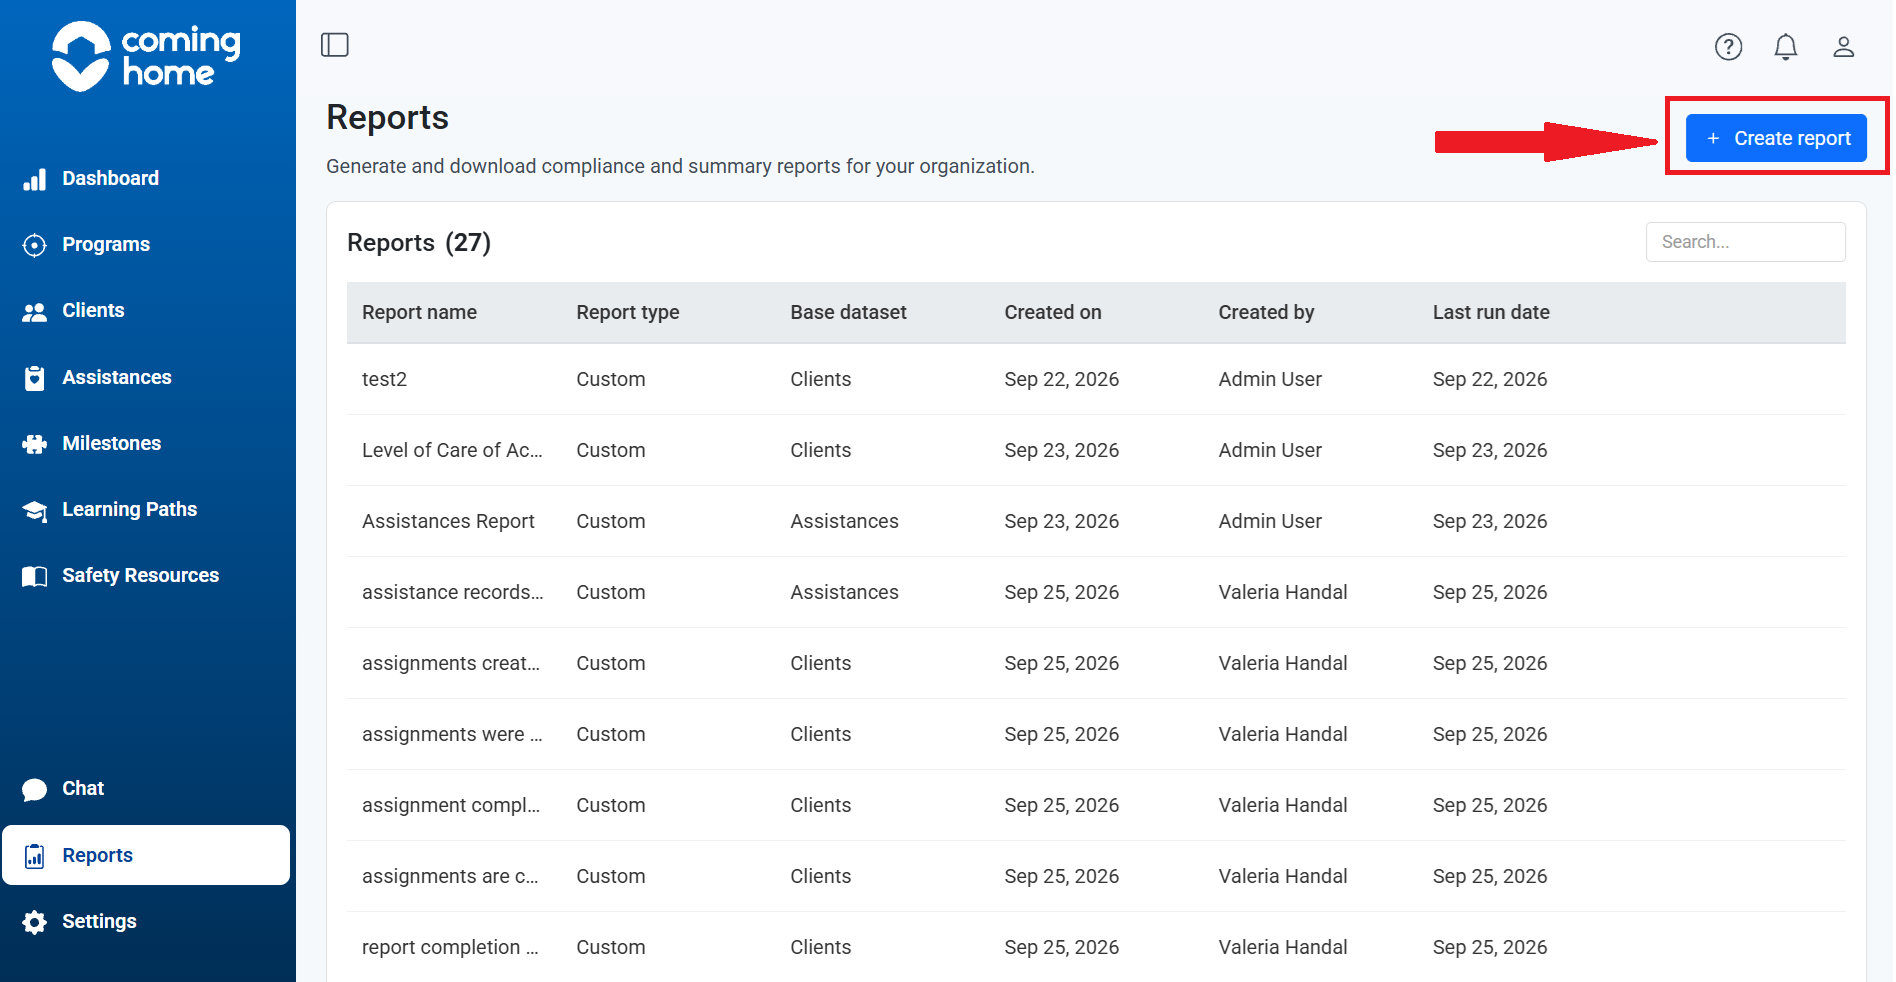
- Click Create report.
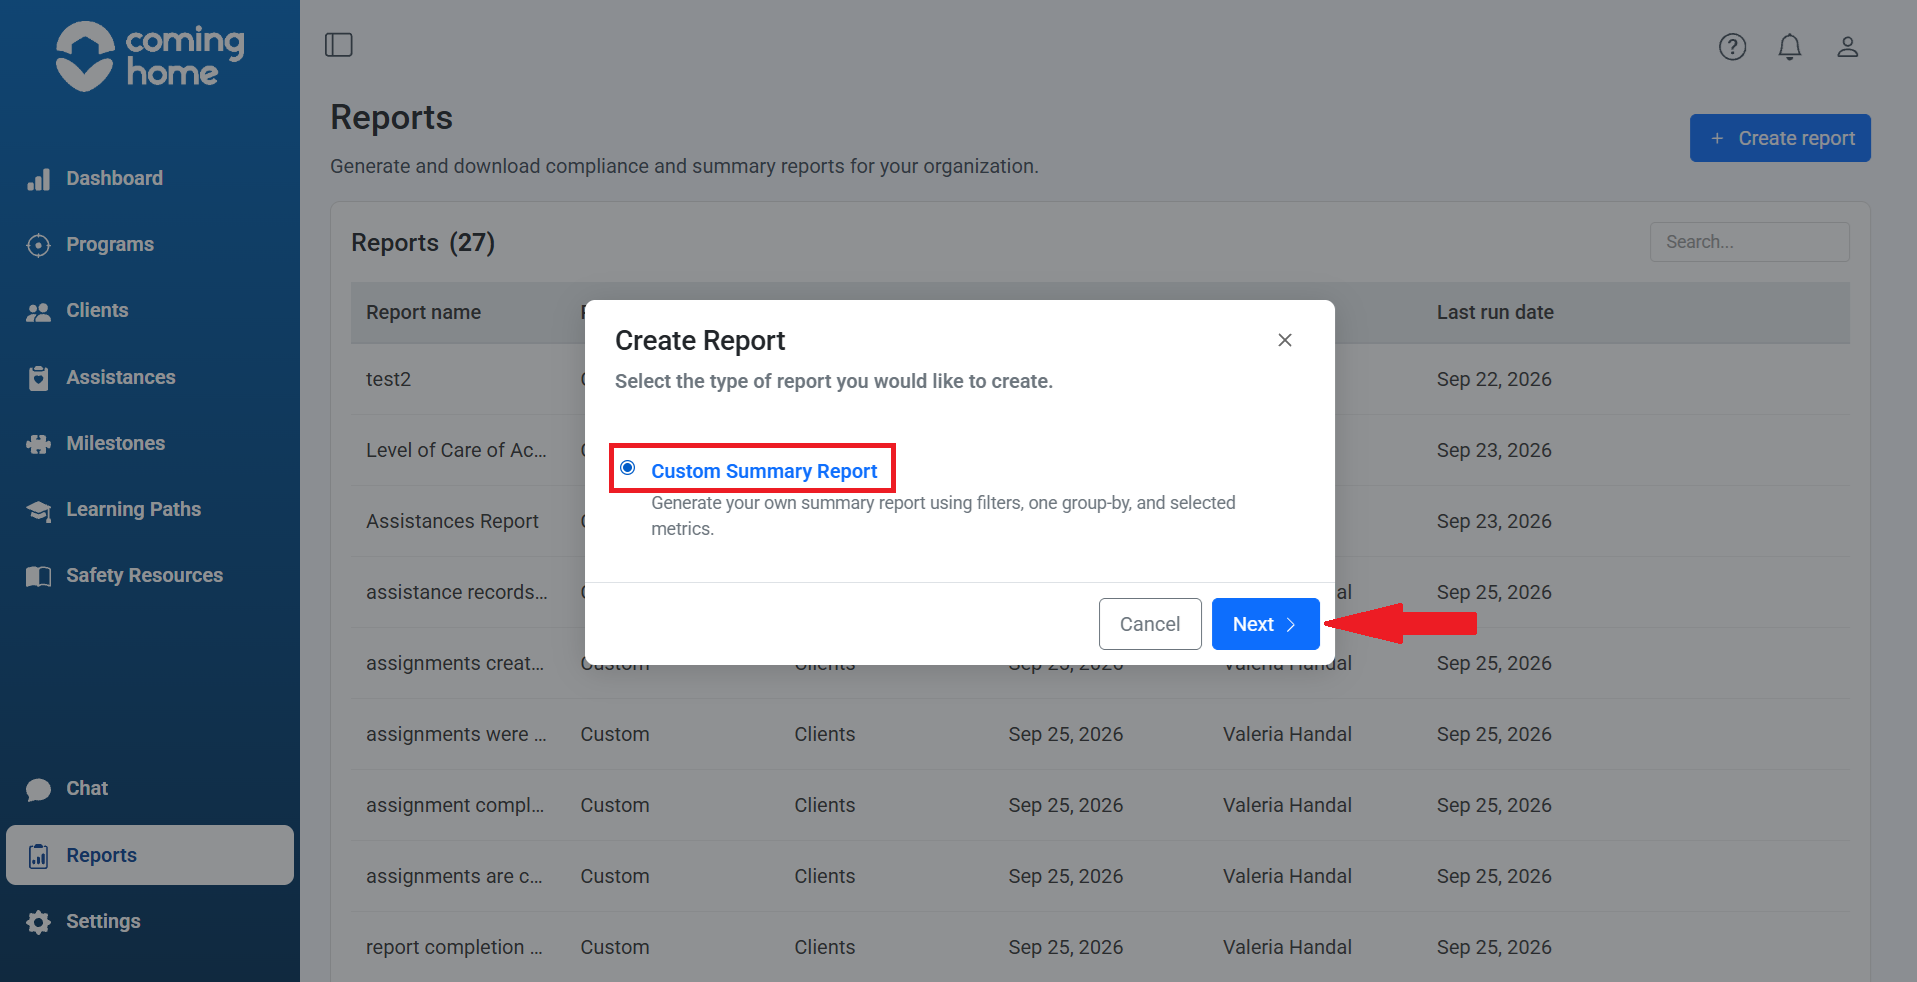
- Choose Custom Summary Report.
Step 2: Complete General Setup
Before you can configure filters, complete the four required fields.
Dataset
Select Assistances.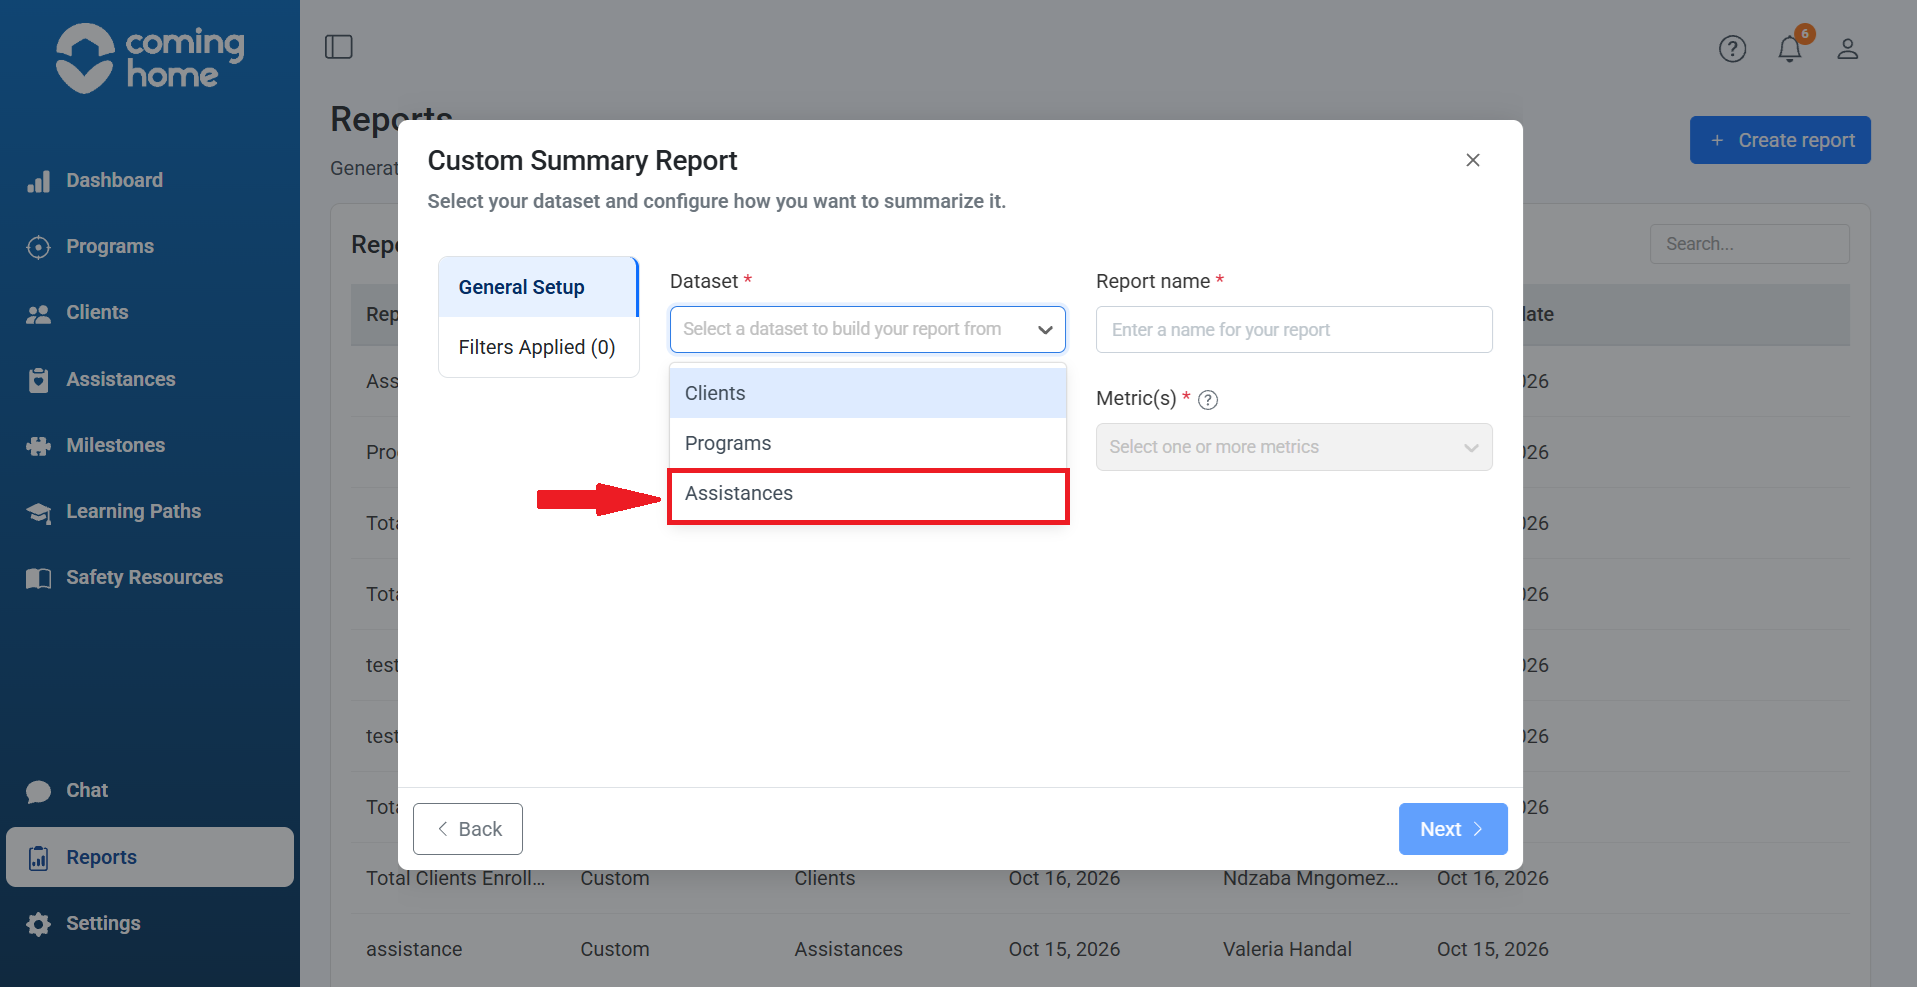
We're choosing Assistances because we want to report on services and support provided, not just client or program information.
Report name
Enter a descriptive name, such as Outreach Program Assistances - September 2026. This helps you recognize the saved report in Reports Home.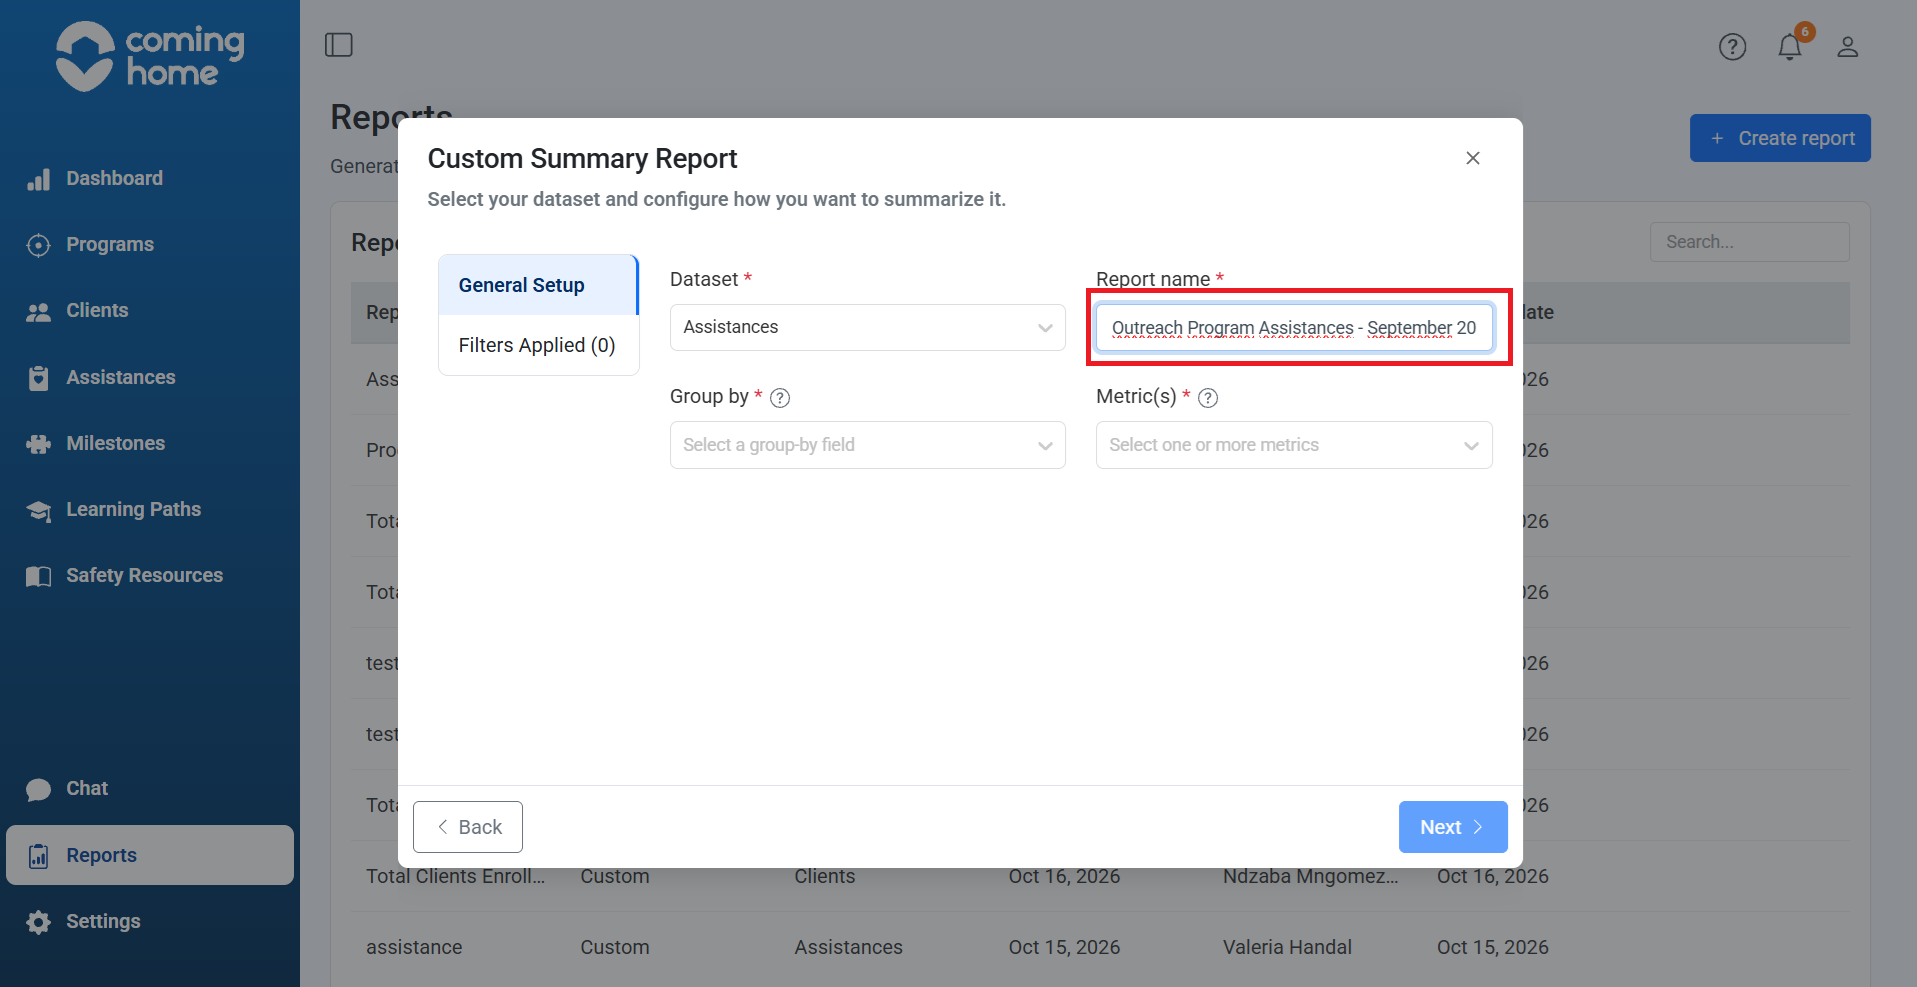
Group by
Select Assistance Type.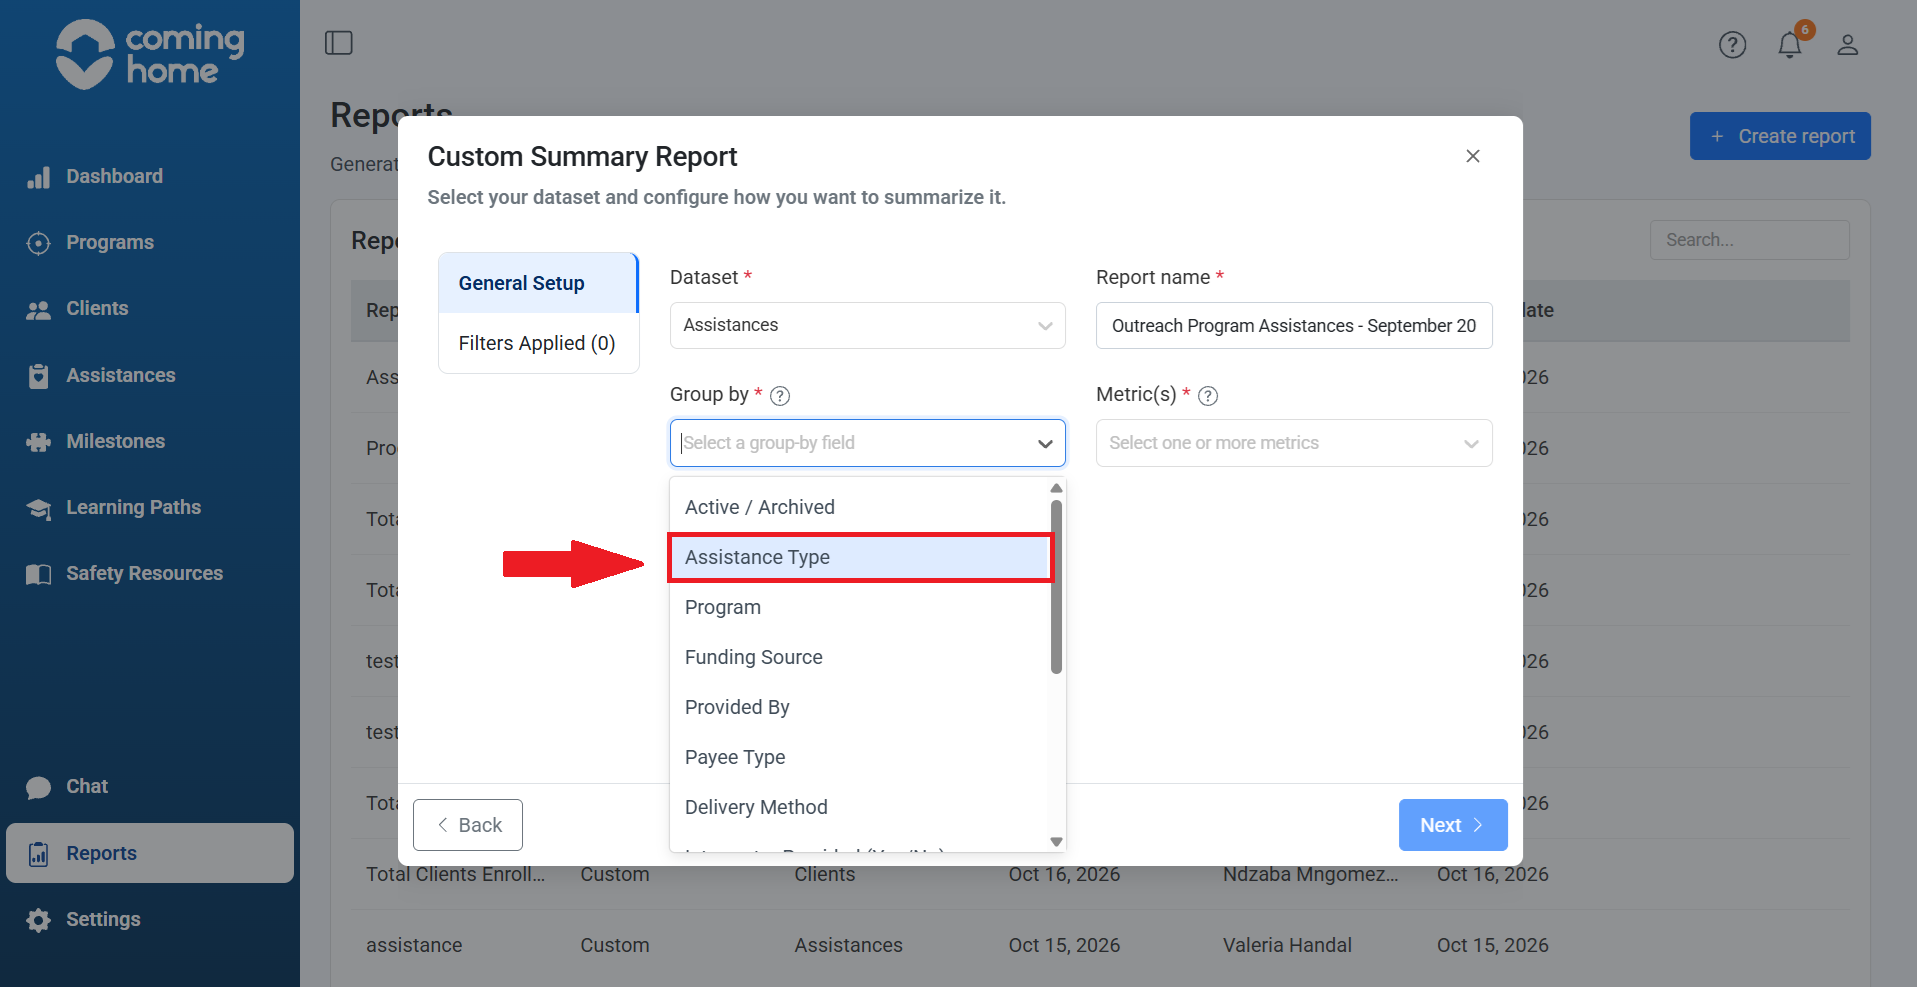
This organizes the results into separate categories based on the type of Assistance provided.
Metric(s)
Select Total Assistance Records.
This metric counts matching Assistance records within each group.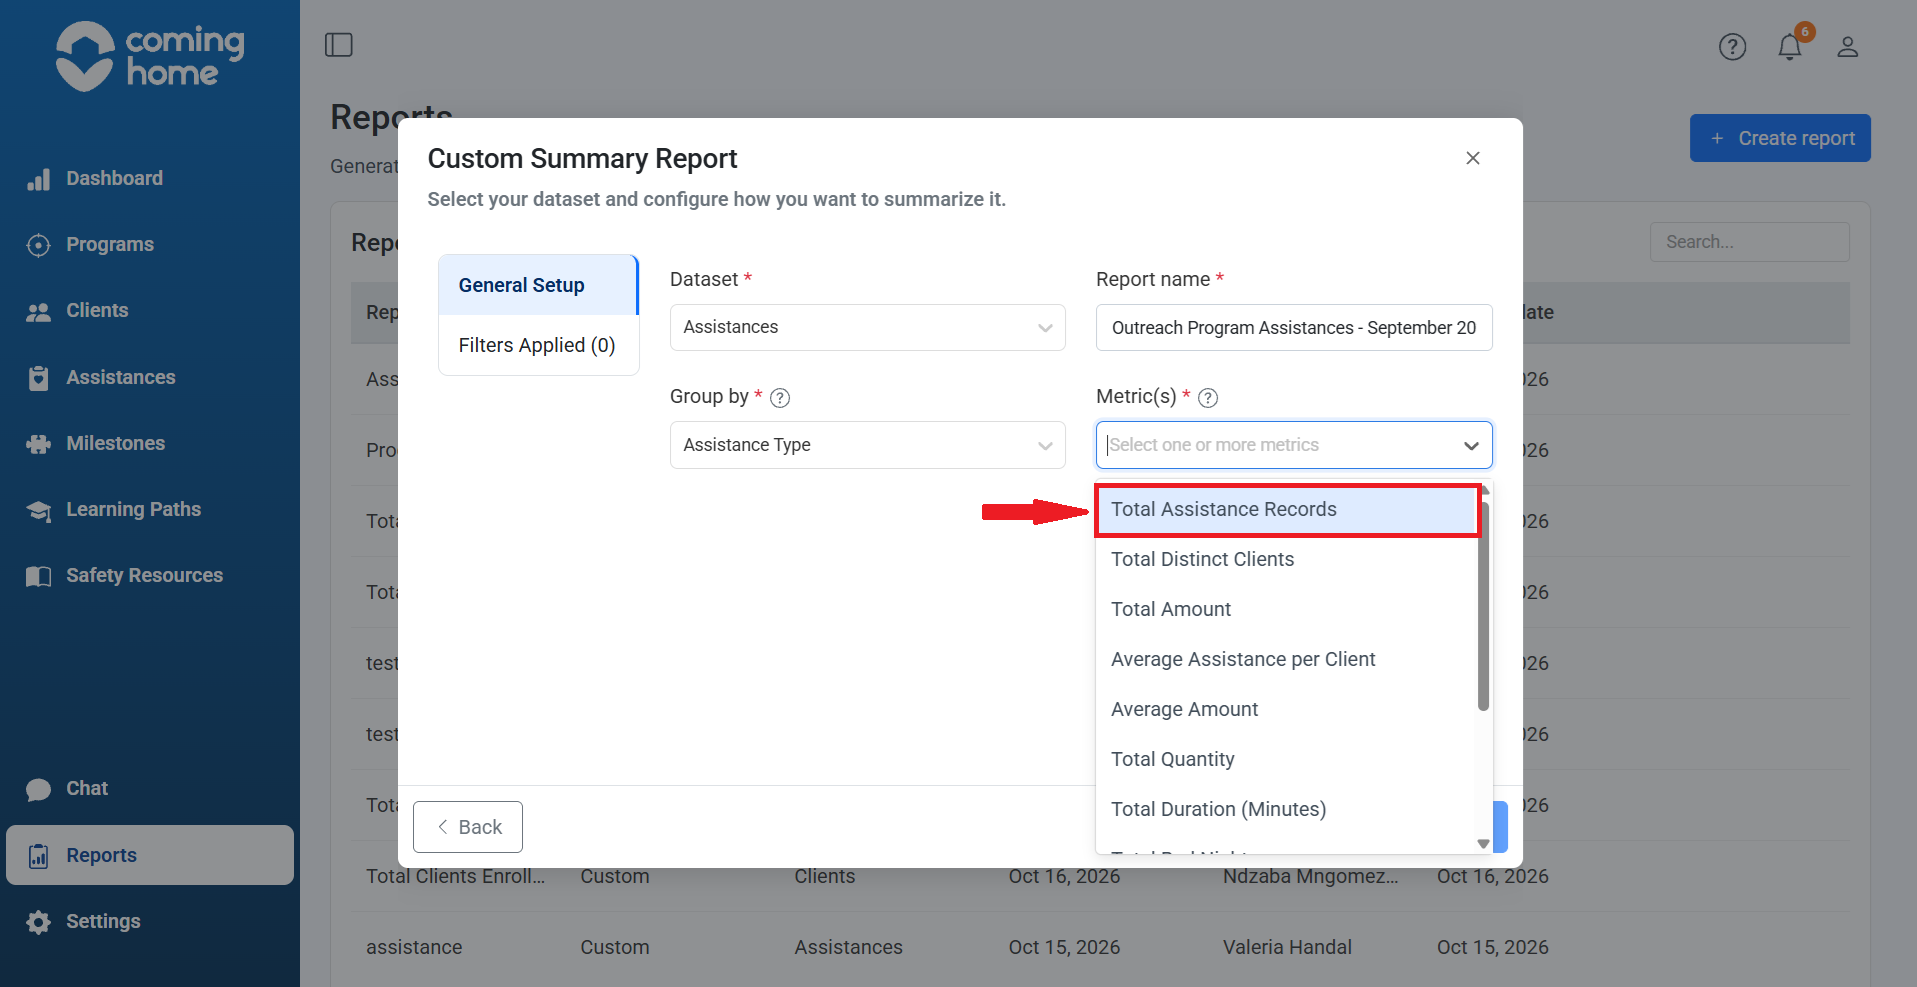
Once all four fields are complete, click Next.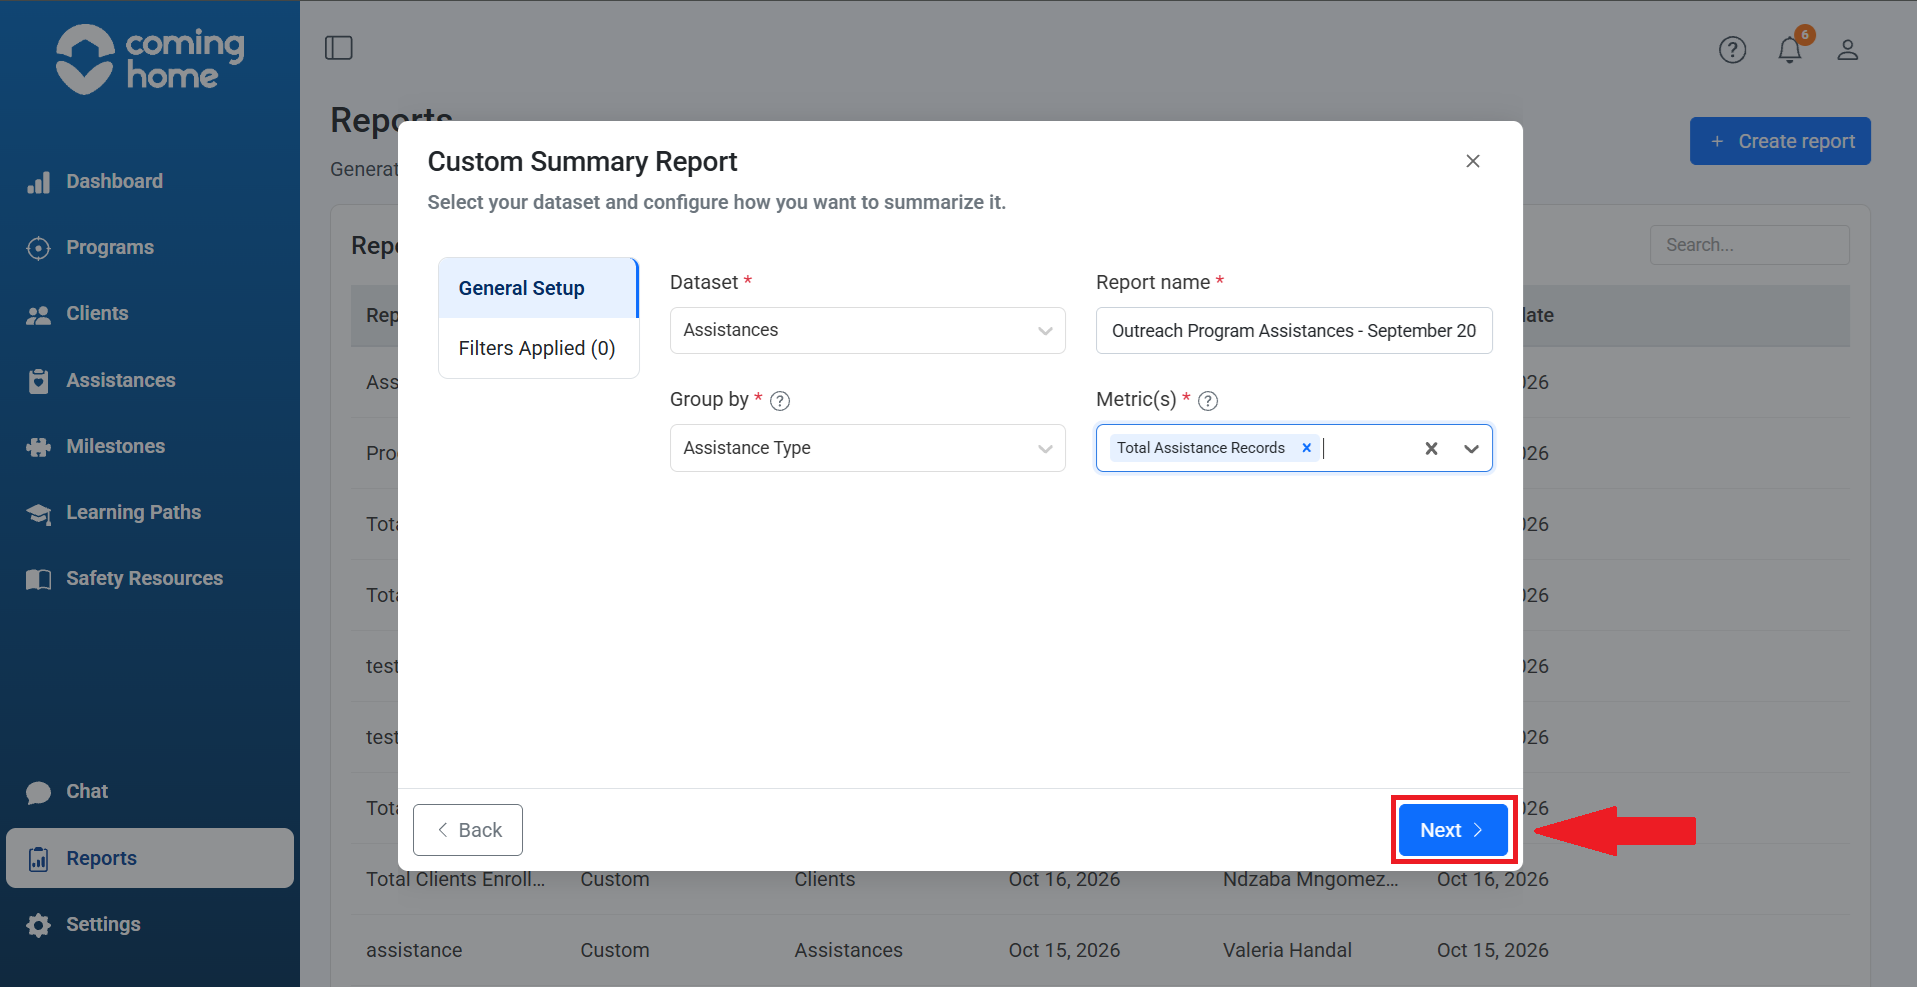
Step 3: Open Filters Applied
The next screen is Filters Applied.
Click + Add filter to begin adding your reporting conditions.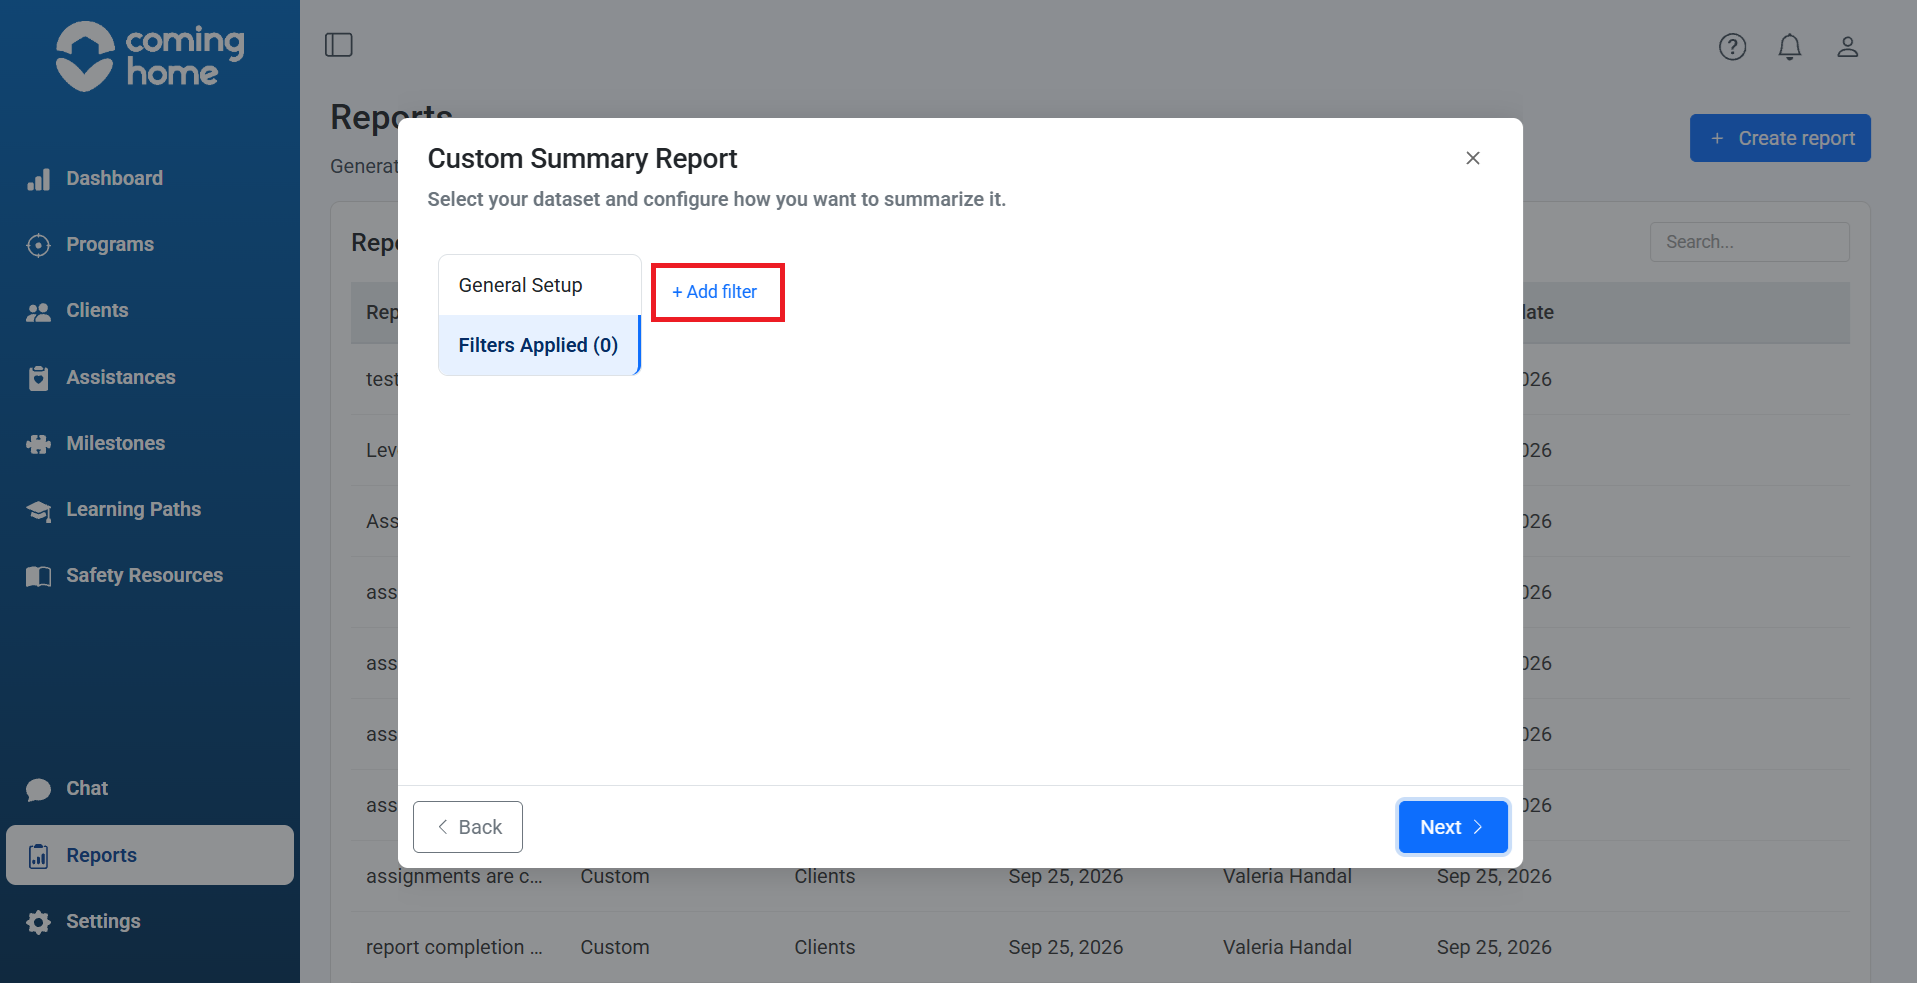
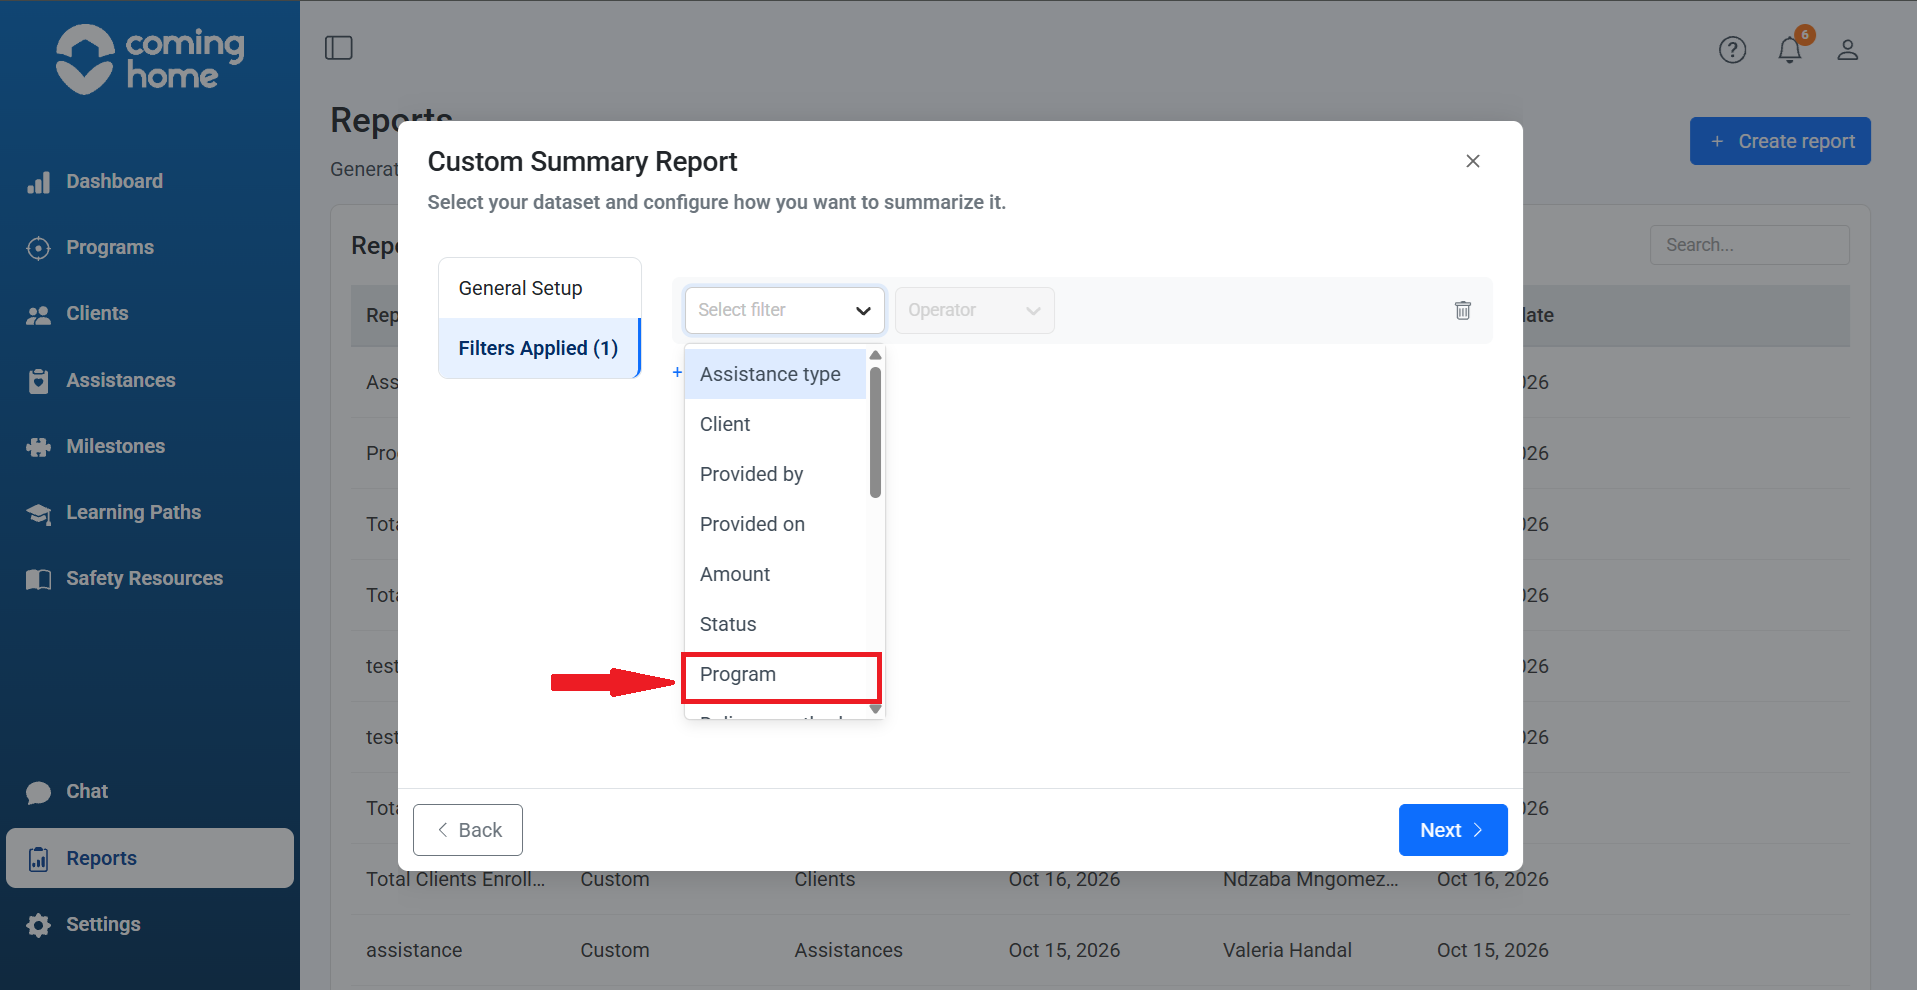
Step 4: Add a Program filter
- Select the available Program filter.
- Choose an available Program as the filter value. (Your programs may be different from those listed here.)
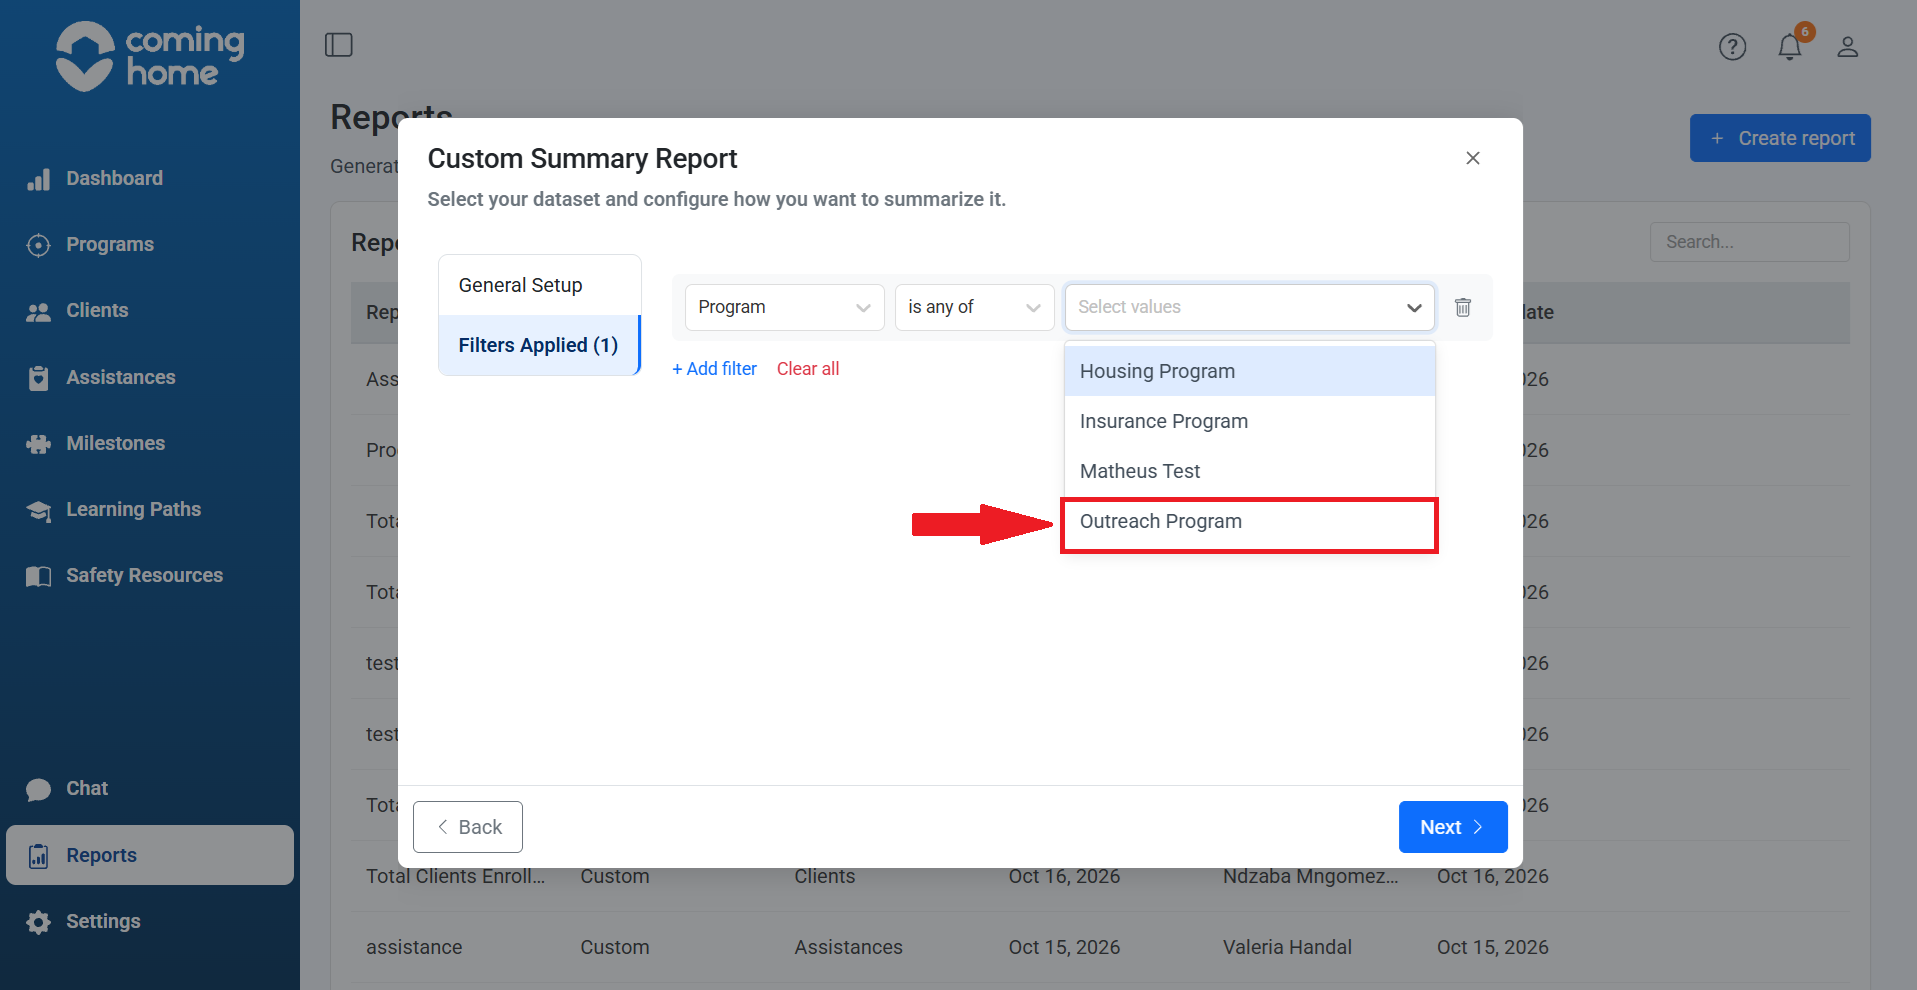
Why? We only want records associated with a single program (in this example the Outreach Program). Without this filter, the report could include Assistances from other programs.
Step 5: Add a date filter
- Click + Add filter again.
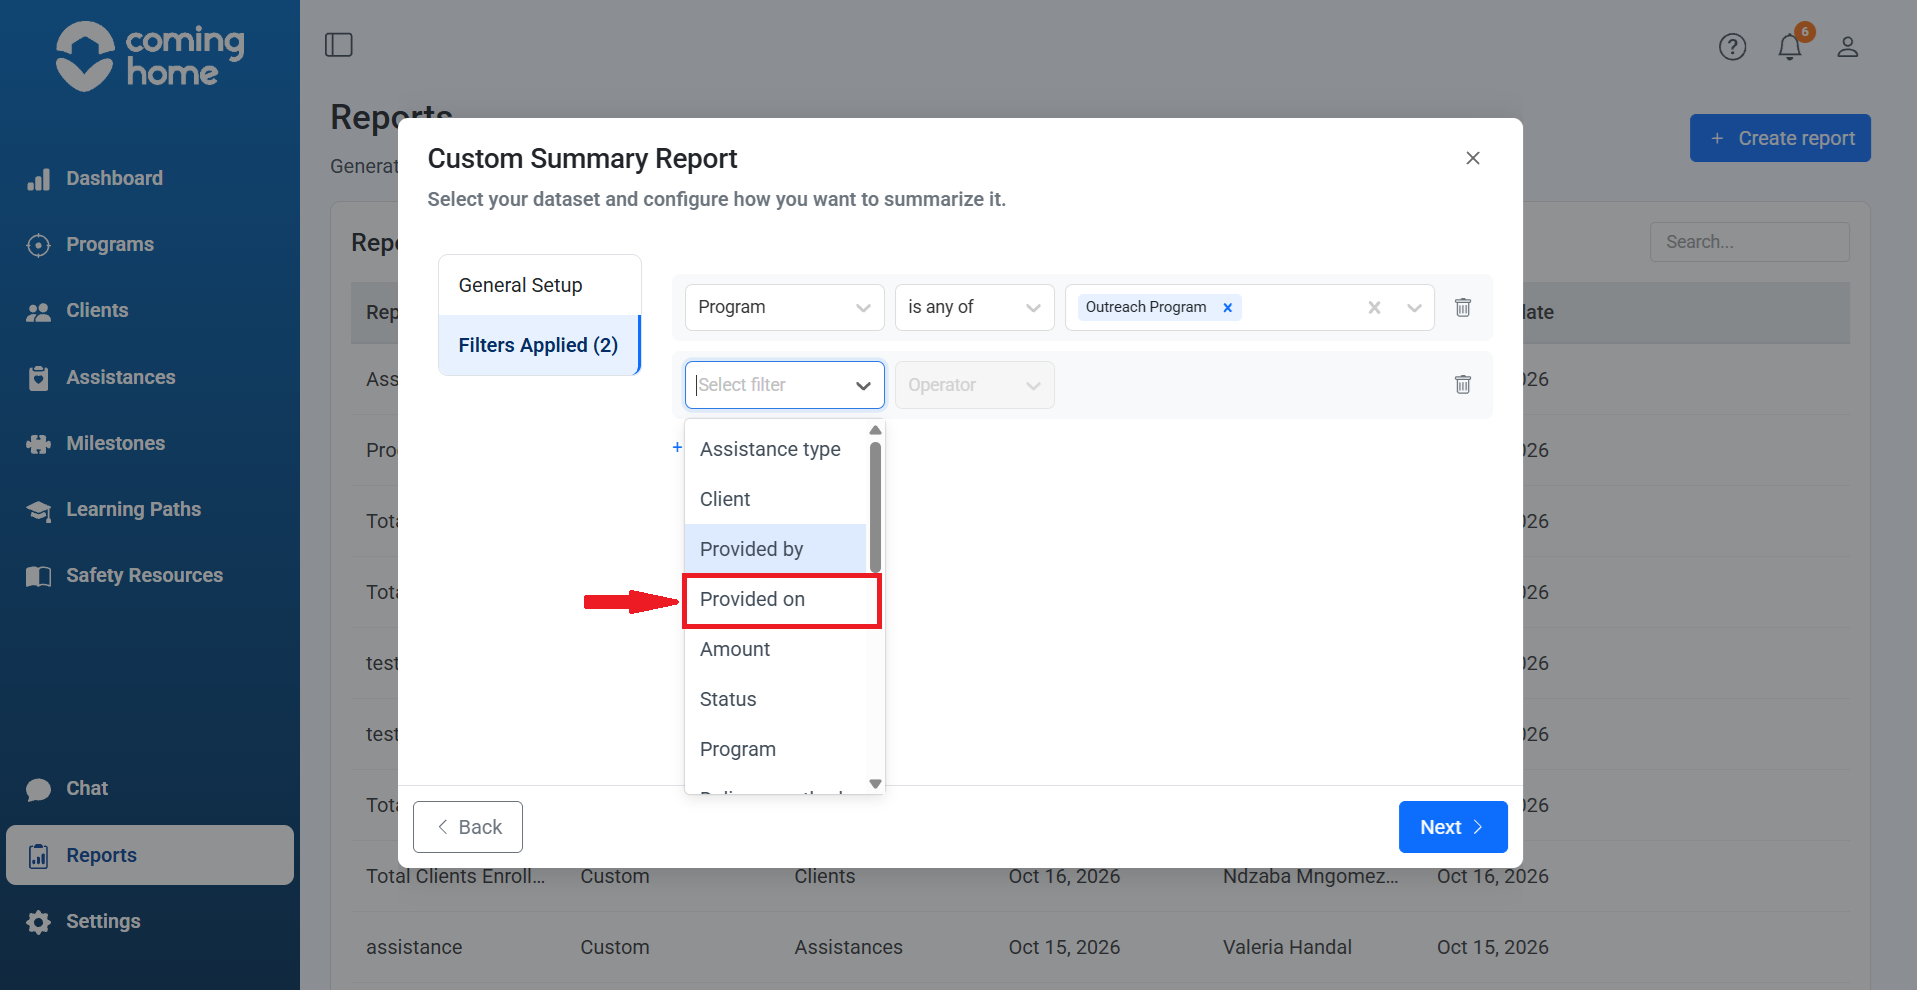
- Select the filter for the date Assistance was provided (Provided On).
- Set the date range to September 1 through September 30, 2026.
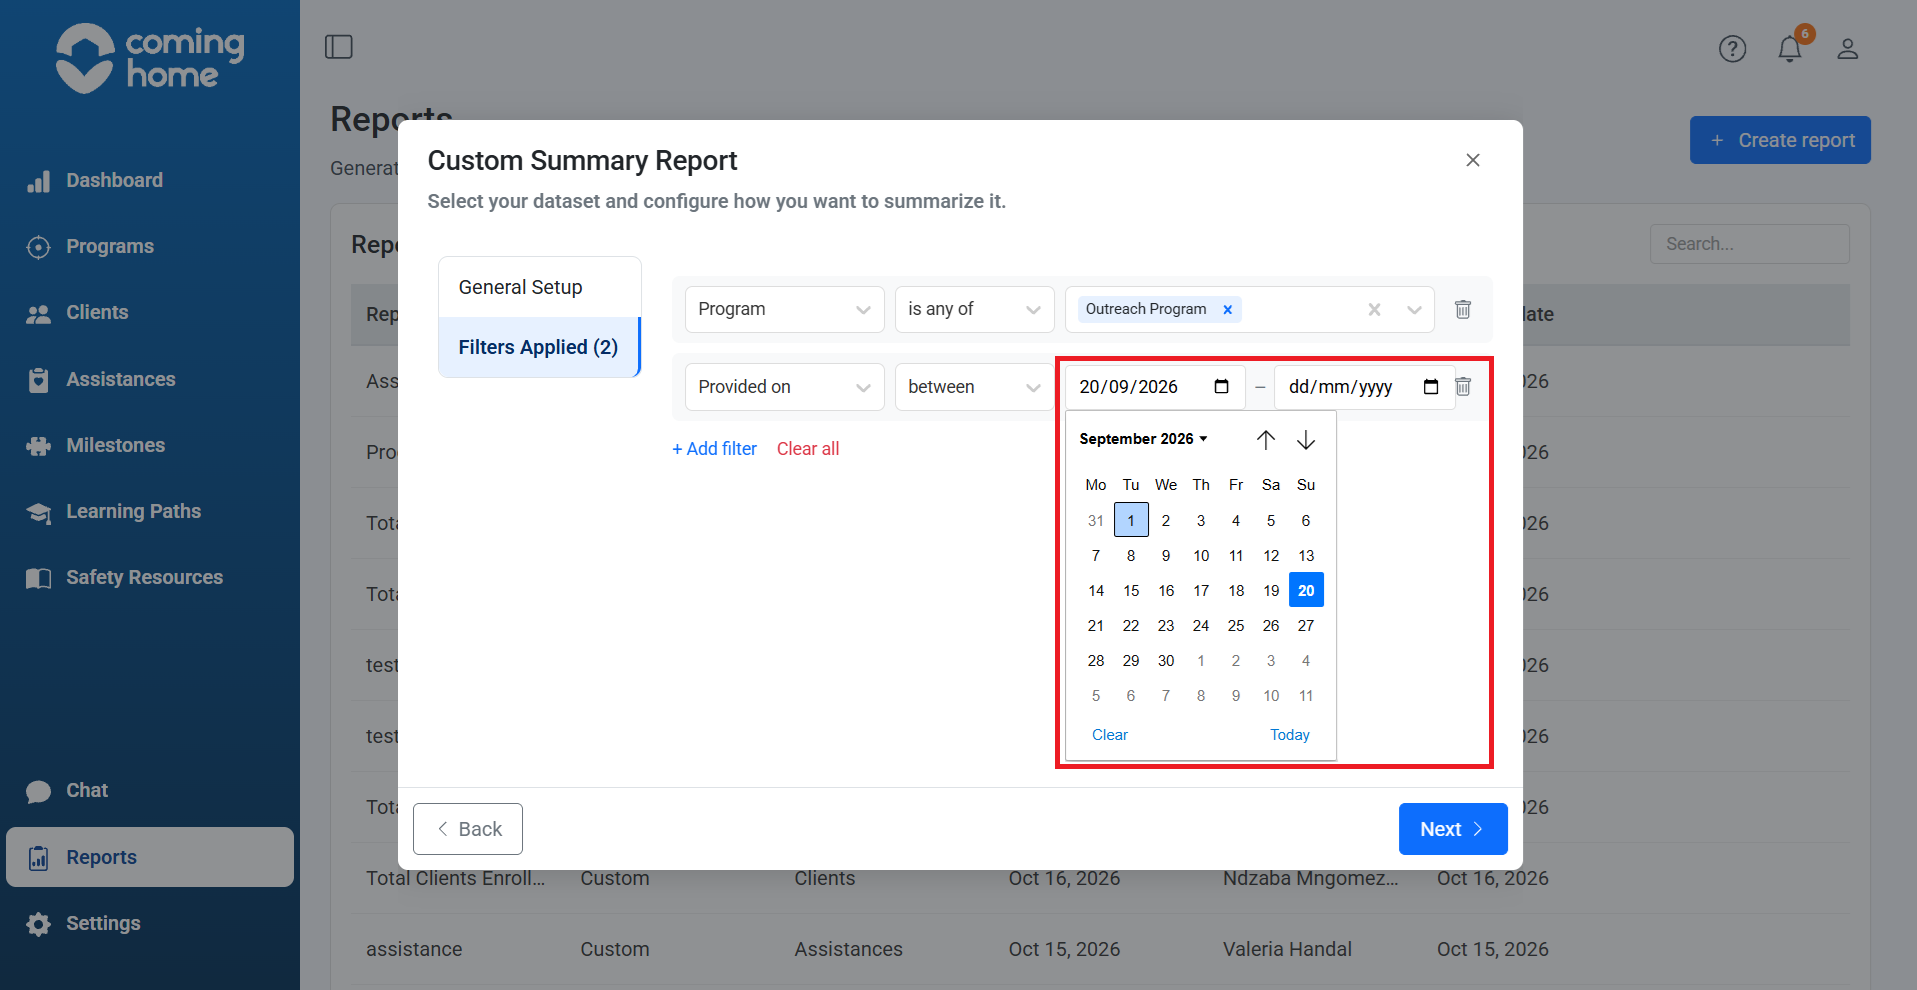
Why? The Program filter tells Coming Home which program to include, while the Provided On filter selects the reporting period. Together, they focus the report on the Outreach Program during September.
Step 6: Continue to Review Report Details
Once your filters are configured, click Next.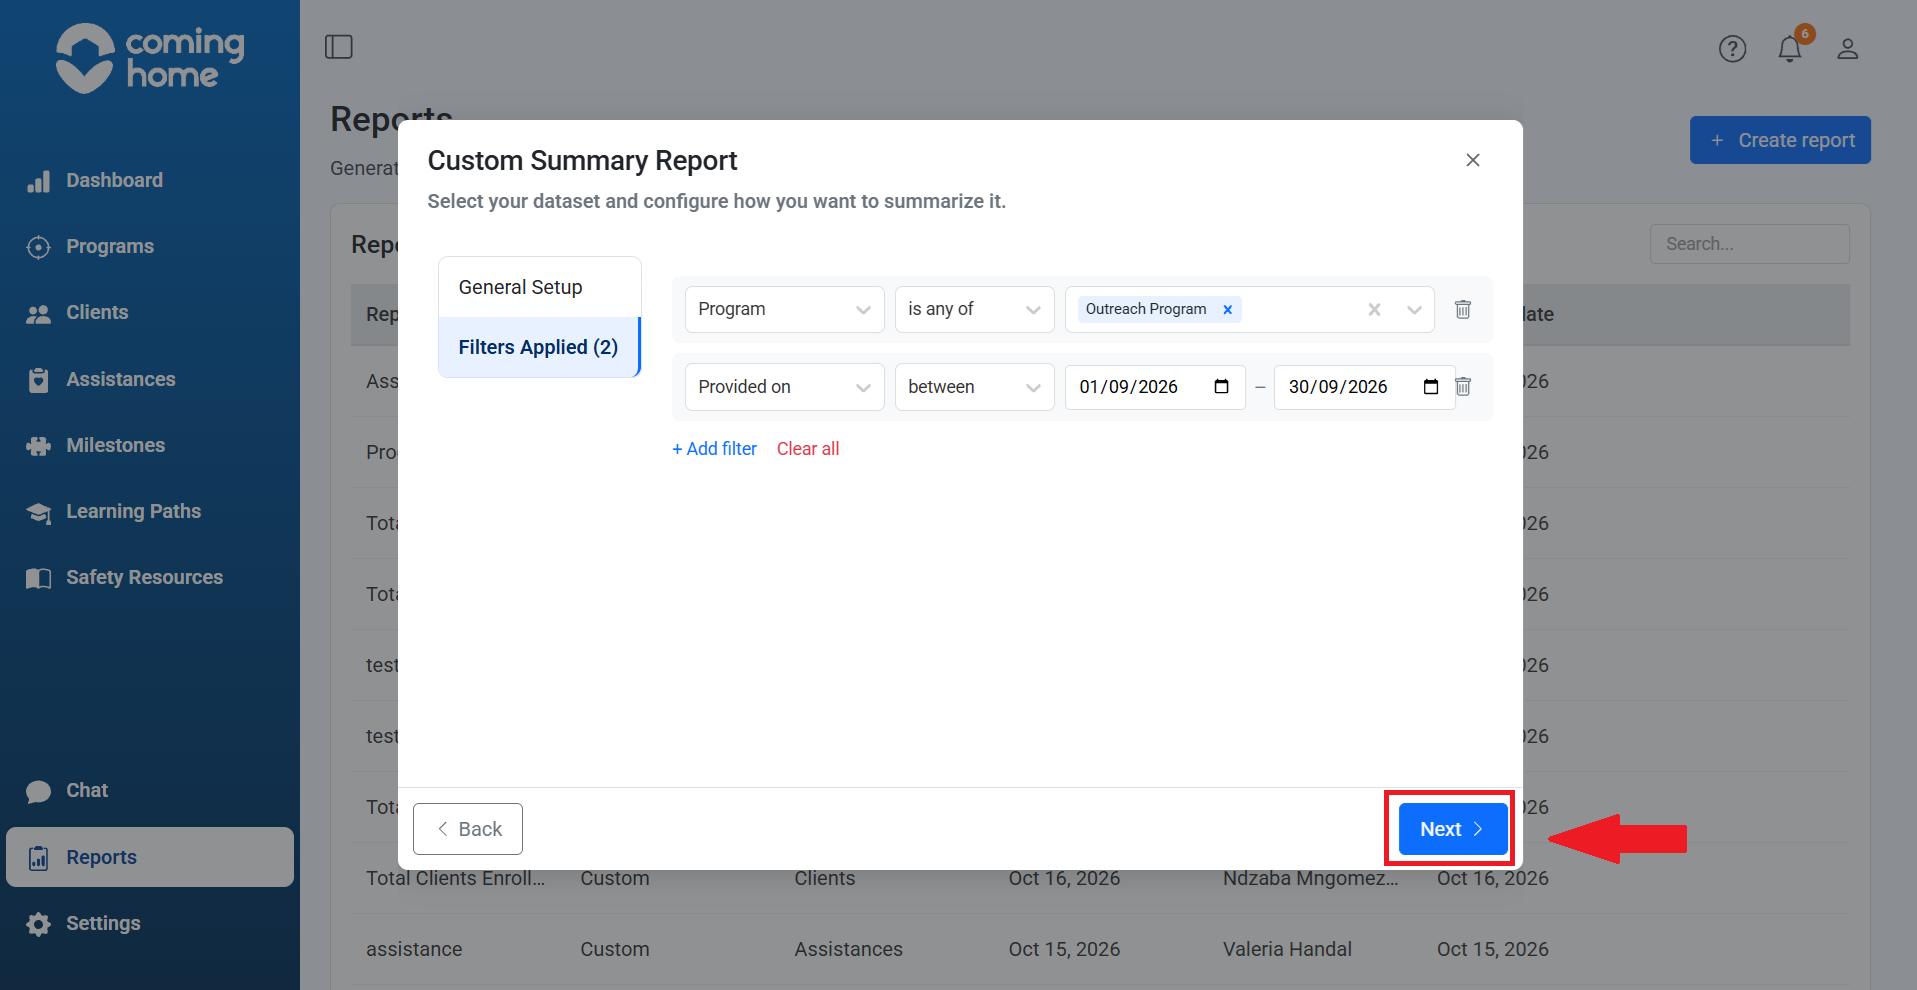
The Review Report Details screen displays your report information.
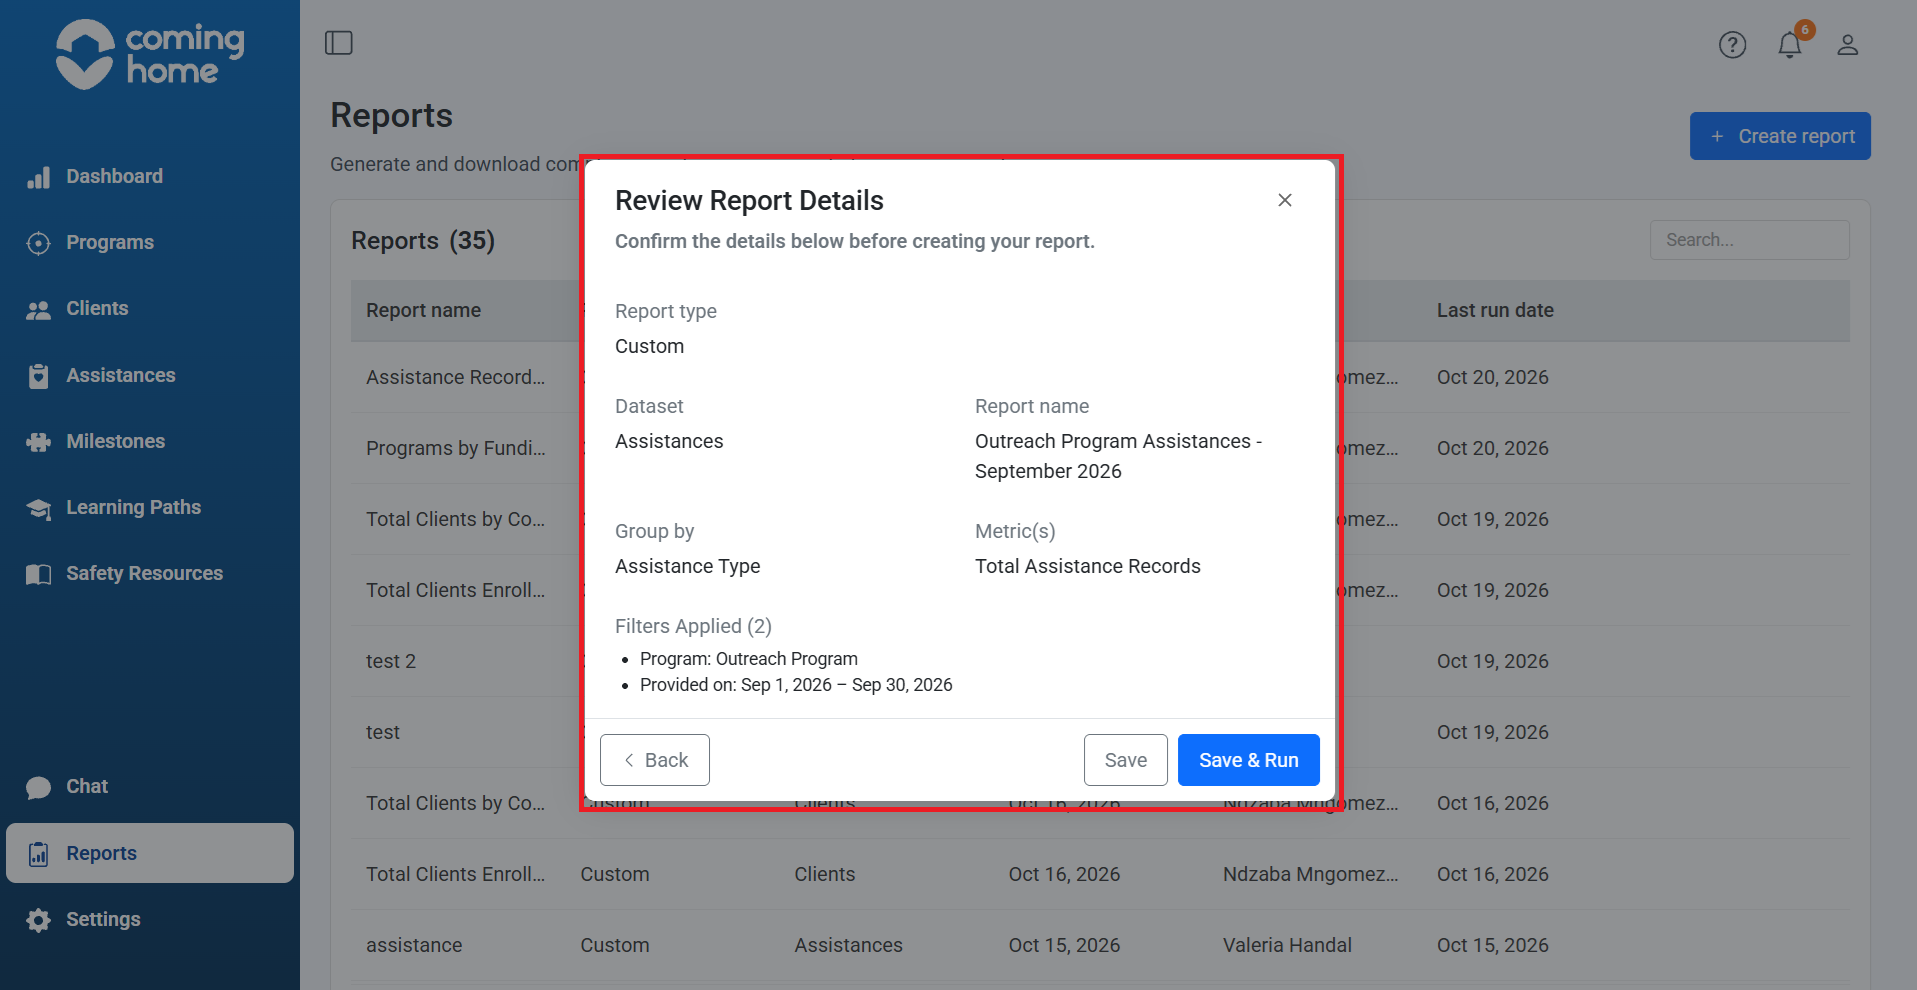
Make sure the report settings and filters match your question. Use Back if you need to change the conditions in Filters Applied.
Step 7: Save & Run your report
Click Save & Run.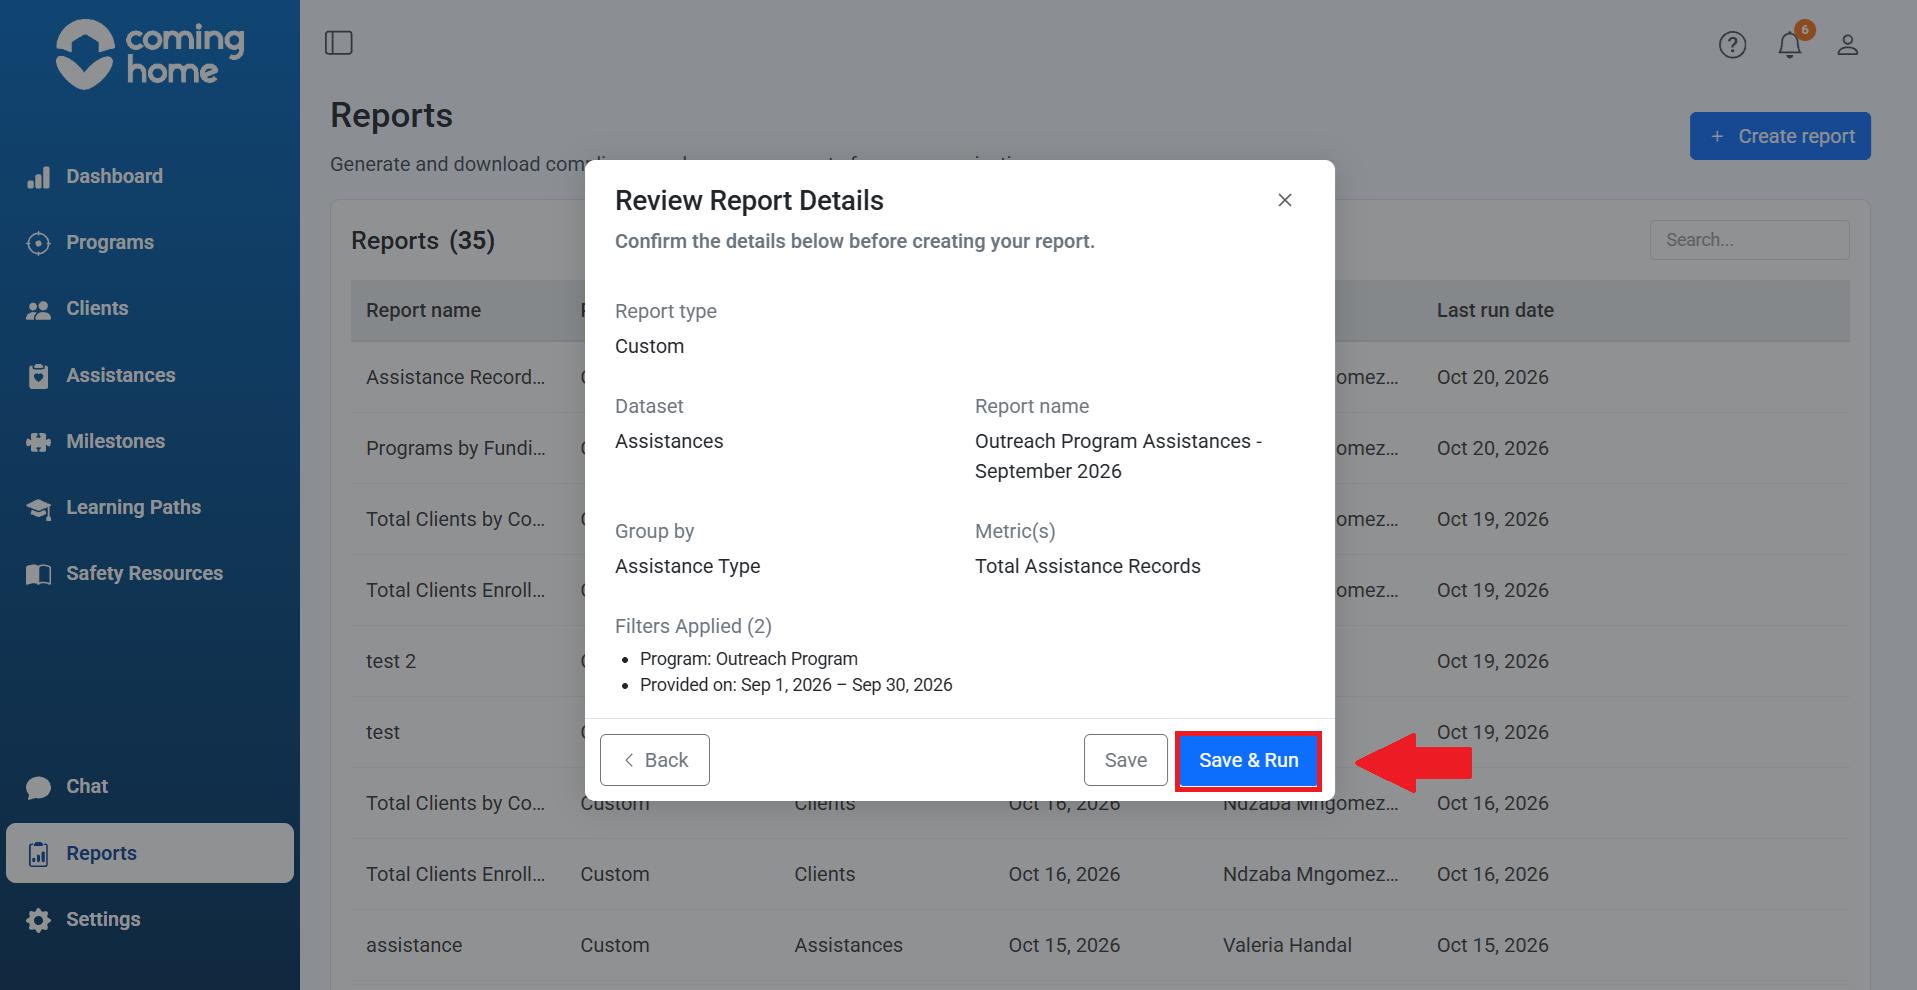
Coming Home saves your configuration and automatically begins generating the results.
You do not need to select Run separately.
Step 8: Download and review your report
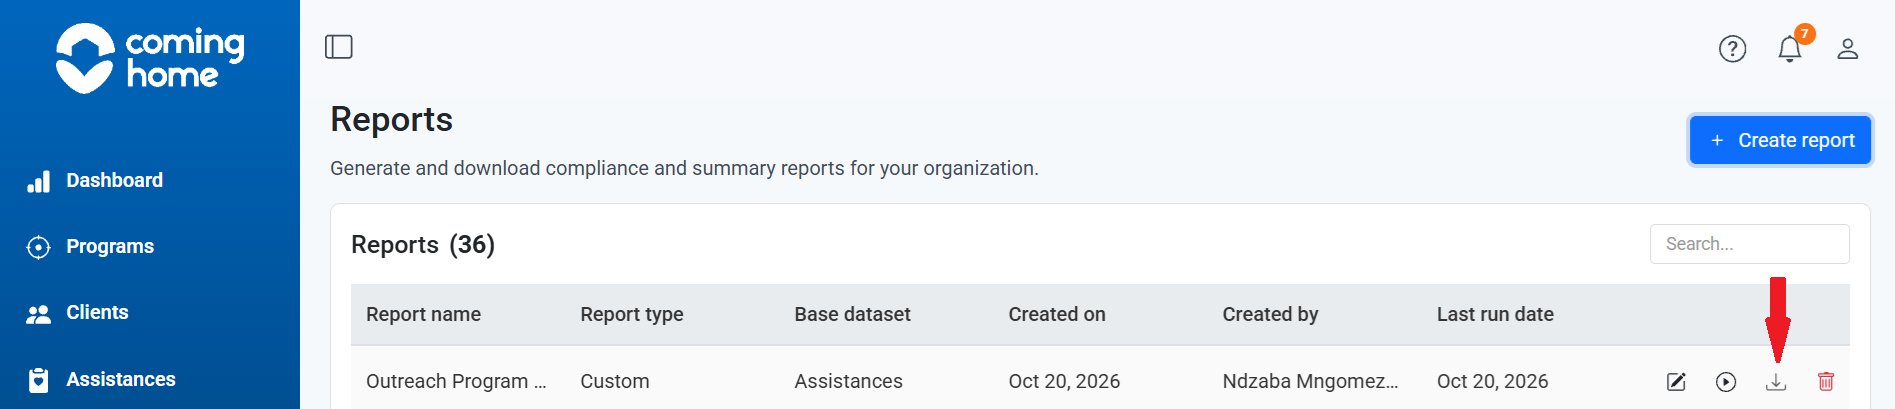
Hover your mouse cursor over your custom report to see the options menu for that report. Select  Download to retrieve the generated CSV file. The file will be downloaded to the Downloads folder on your computer, or wherever your browser downloads files by default.
Open the file in Microsoft Excel, Google Sheets, or another compatible spreadsheet application.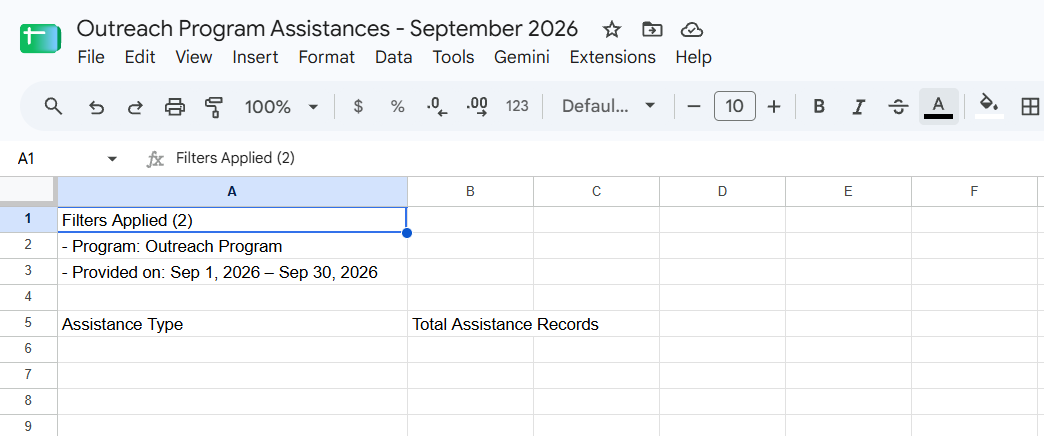
Your report will show the Assistance Types matching your selected conditions and the total number of records for each type.
Can I use more than one filter?Yes. Custom Reports supports multiple filters.
For example, you might want to focus on:
- A particular program.
- A specific Assistance type.
- A selected reporting period.
For example, Program = Outreach Program and Provided On = September 1–30, 2026. Both conditions help determine which Assistance records are counted.
How is a filter different from Group By?
Group By and Filters work together, but they do different things.
Group By: Organizes the results into categories. For example, choosing Assistance Type gives a separate count for each type of service.
Filters: Chooses which records are included. For example, include only Assistances from the Outreach Program provided during September.
For our example, Group By = Assistance Type; Filters = Outreach Program and September; Metric = Total Assistance Records.
Think of it this way: Filters decide what to include. Group By decides how to organize it. Metrics decide what to count or calculate.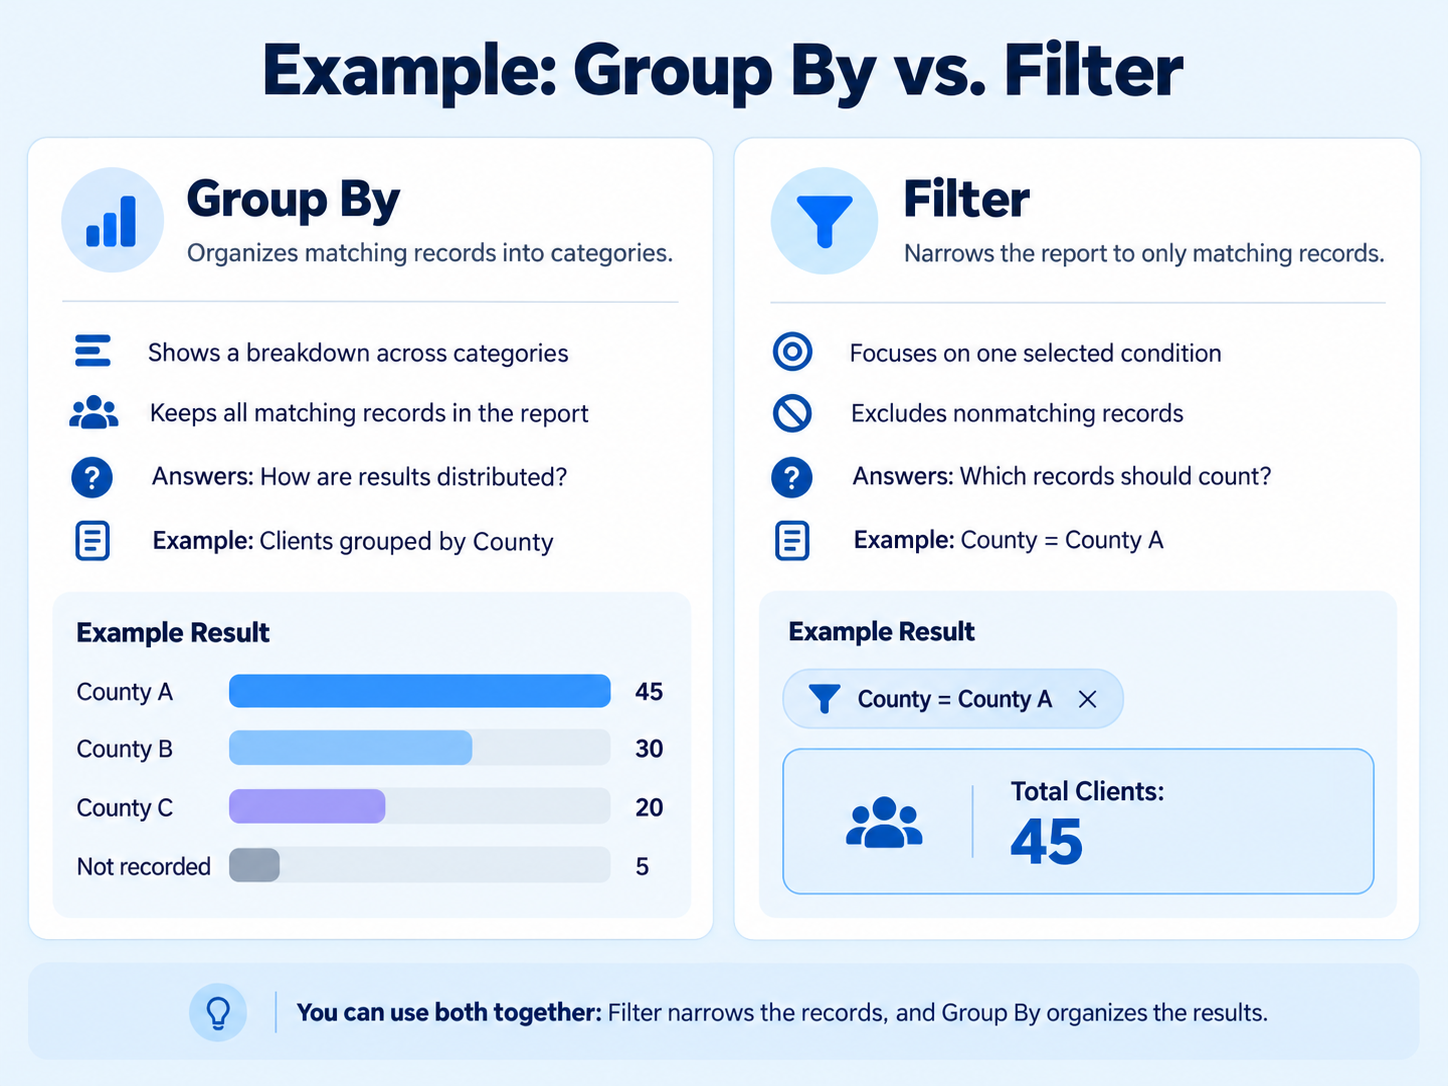
Are filters required?
No. Filters are optional.
If you don't need to narrow the information, you can leave the Filters Applied section empty and click Next.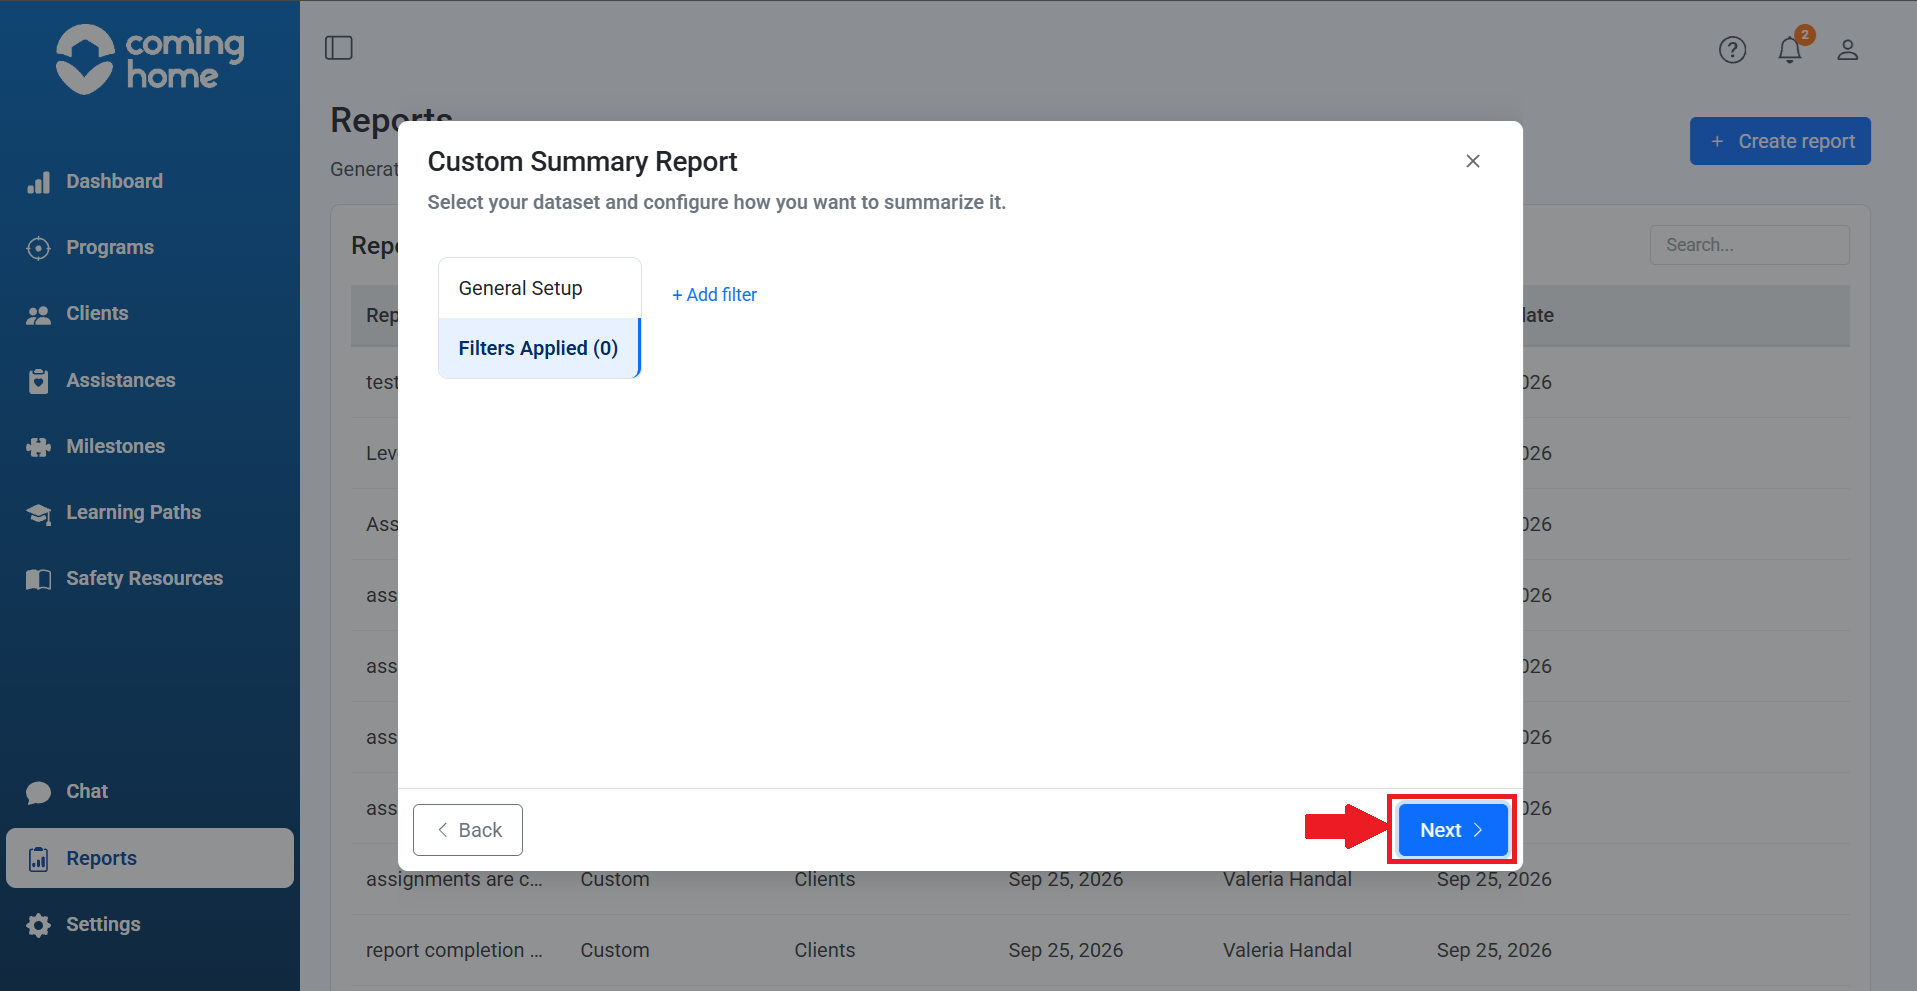
Coming Home will calculate the selected metrics using all matching records available within your reporting scope.
What does this mean for your reporting?
Filters help your organization answer more specific questions without manually reviewing individual records.
They're especially useful when reporting on a particular program, service, or reporting period.
Remember:
- Dataset determines which type of records you're reporting on.
- Group By determines how the results are organized.
- Metrics determine which numbers are calculated.
- Filters narrow the records included in those calculations. Together, these choices help answer the questions your organization needs to ask.
Related Articles
- What datasets are available in Custom Reports?
- What metrics can I use in Custom Reports?
- What is the difference between current and historical reporting?