
Understanding metrics
A metric is a number or calculation Coming Home uses to measure information in your report.
Metrics help answer questions such as:
- How many clients do we have?
- How many assignments have been completed?
- What is the average length of stay?
- How many Assistances were provided?
For example, selecting Total Enrolled Clients tells Coming Home to count the number of clients enrolled in a program.
If you group those clients by County, the report calculates the Total Clients metric for each county.
What metrics are available?
The available metrics depend on your selected dataset.
Clients dataset
|
Metric |
What it measures |
|
Total Clients |
Number of matching client records |
|
Total Enrolled Programs |
Total program enrollments across matching clients |
|
Average Enrolled Programs per Client |
Average number of program enrollments per matching client |
|
Average Age |
Average age of matching clients with a recorded age |
|
% of total clients |
Percentage of matching clients belonging to each group selected in “Group By” |
|
Total Assignments |
Number of matching assignment records |
|
Completed Assignments |
Number of assignments marked Completed |
|
Active Assignments |
Number of assignments marked Active |
|
Late Assignments |
Number of assignments past their recorded end date |
|
Average Time to Complete Assignments |
Average (mean) number of days between assignment and completion for eligible completed assignments |
|
Median Time to Complete Assignments |
Middle (median) completion time in days for eligible completed assignments |
|
Completion Rate |
Completed assignments as a percentage of total assignments across matching clients |
Important: Assignment metrics count assignment records, not unique clients. For example, if Client A and Client B have each completed Assignment X and Assignment Y, then the number of Completed Assignments will be 4.
Programs dataset
|
Metric |
What it measures |
|
Program Count |
Number of matching program records |
|
Total Enrolled Clients |
Sum of recorded enrolled-client totals across matching programs |
|
Average Length of Stay |
Average (mean) recorded enrollment duration in days |
|
Median Length of Stay (days) |
Middle (median) recorded enrollment duration in days |
Important: Total Enrolled Clients is not necessarily a count of unique people across all programs. A client enrolled in more than one program may contribute to multiple enrollment totals. For example, if Client A is enrolled in Program X and Program Y, then Total Enrolled Clients will be 2.
Assistances dataset
|
Metric |
What it measures |
|
Total Assistance Records |
Number of matching Assistance records |
|
Total Distinct Clients |
Number of unique clients who received matching Assistance (see Assistance Records vs. Distinct Clients for more details) |
|
Total Amount |
Sum of recorded monetary Assistance amounts |
|
Average Assistance per Client |
Average number of Assistances per distinct client |
|
Average Amount |
Average recorded monetary amount per Assistance record, excluding records without amounts |
|
Total Quantity |
Total recorded units or items provided |
|
Total Duration (Minutes) |
Total recorded Assistance duration in minutes |
|
Total Bed Nights |
Total recorded bed nights |
|
Total Hotline Interactions |
Total recorded hotline interactions |
|
Total Group Participants |
Total recorded group participants |
|
Number of Assistances with Outcomes Collected |
Number of matching Assistance records containing outcome information |
Understanding Assistance Records vs. Distinct Clients
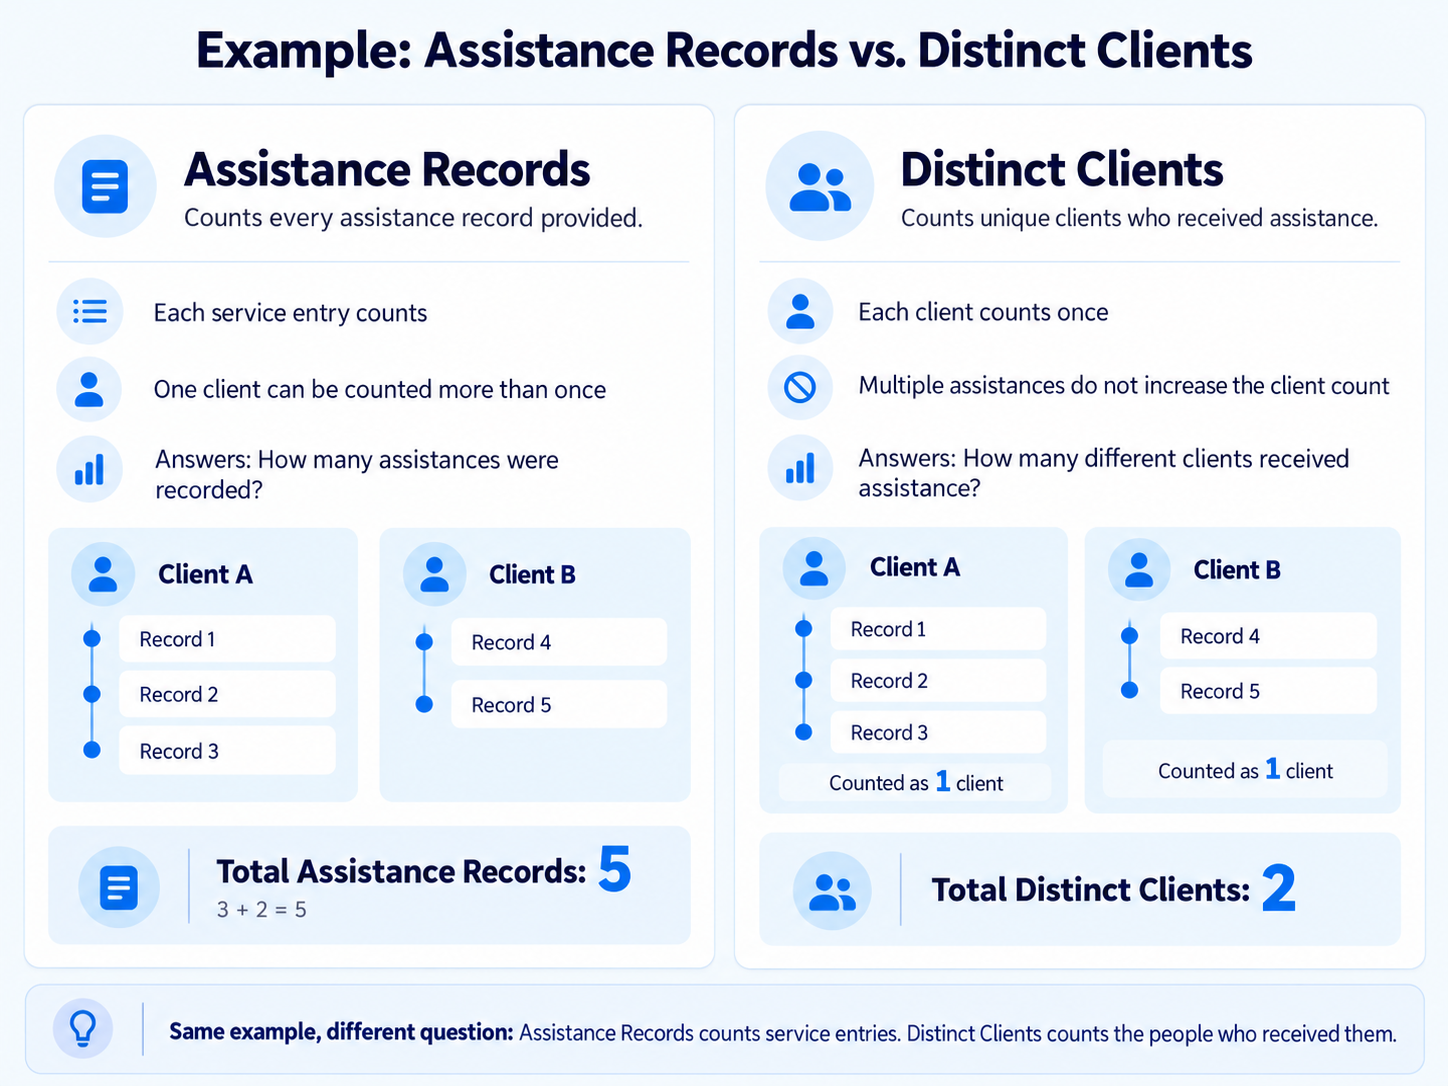
These two metrics answer different questions: how many services were recorded, and how many different people received them.
Imagine your organization recorded five Assistances:
- Client A received Assistance three times.
- Client B received Assistance twice.
Your report would show:
|
Metric |
Result |
|
Total Assistance Records |
5 |
|
Total Distinct Clients |
2 |
Total Assistance Records counts the individual Assistance records.
Total Distinct Clients counts how many different clients received those Assistances.
Both numbers are useful, but they measure different things.
Now imagine your organization has recorded only three Assistances:
- Client A received Assistance X once.
- Client A received Assistance Y once.
- Client B received Assistance Y once.
If your results are grouped by Assistance Type, your report would show:
|
Assistance Type |
Total Distinct Clients |
|
Assistance X |
1 |
|
Assistance Y |
2 |
As shown above, the same client can be counted in more than one Assistance type, so be careful not to add the counts from different types together and assume that gives the total number of different people served.
How to create a report using metrics
Let's create a report comparing the number of Assistance records with the number of distinct clients receiving each type of Assistance.
Step 1: Open Reports Home
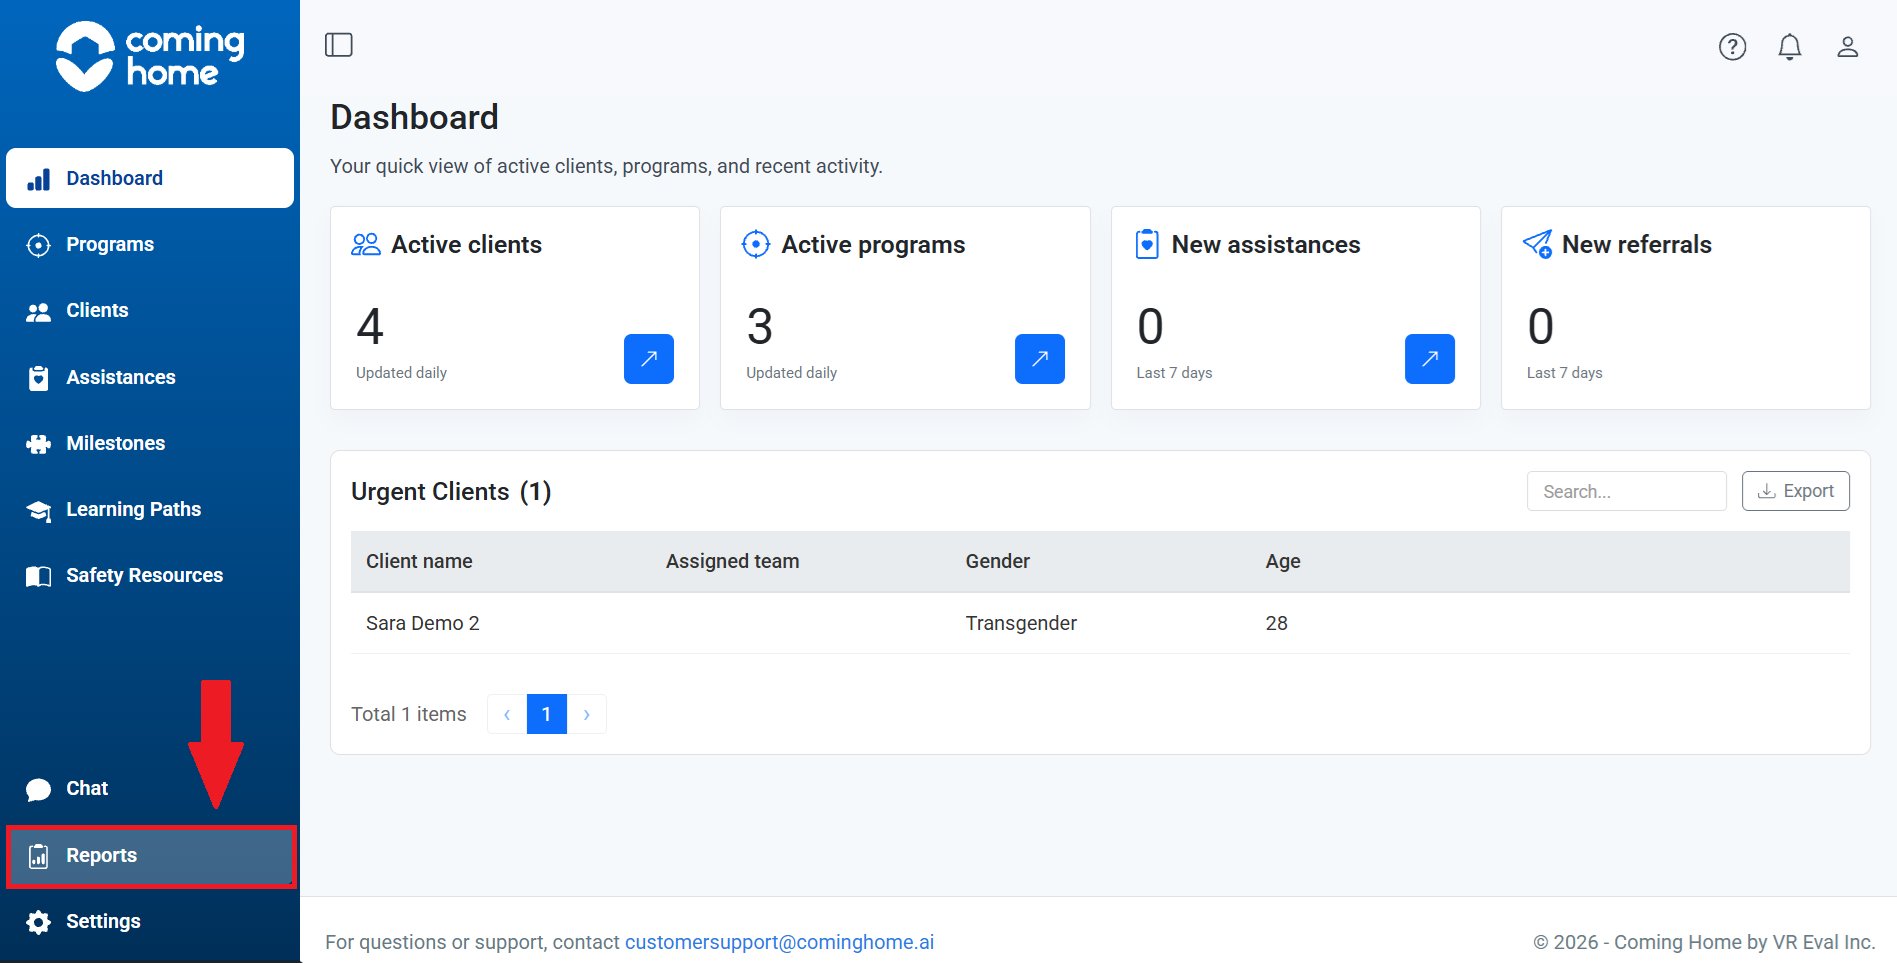
- Select Reports from the left-hand navigation menu to open the place where reports are created and saved.
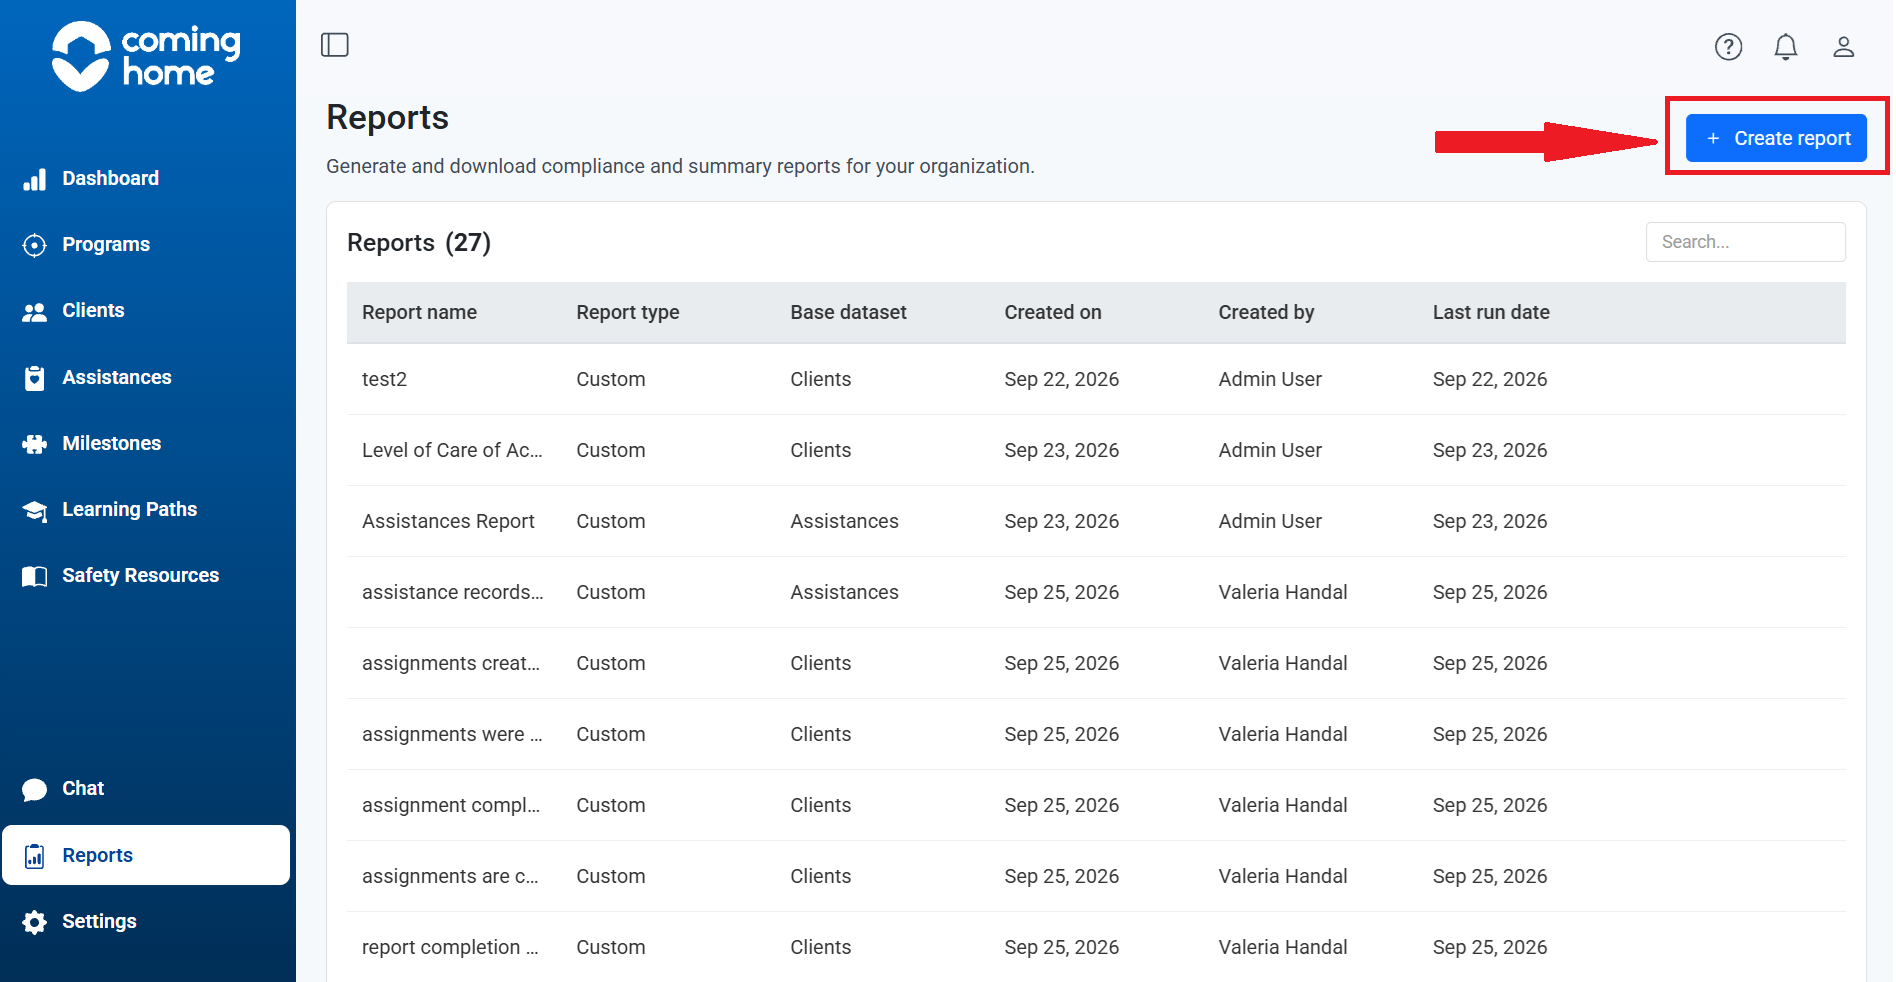
- Click Create report.
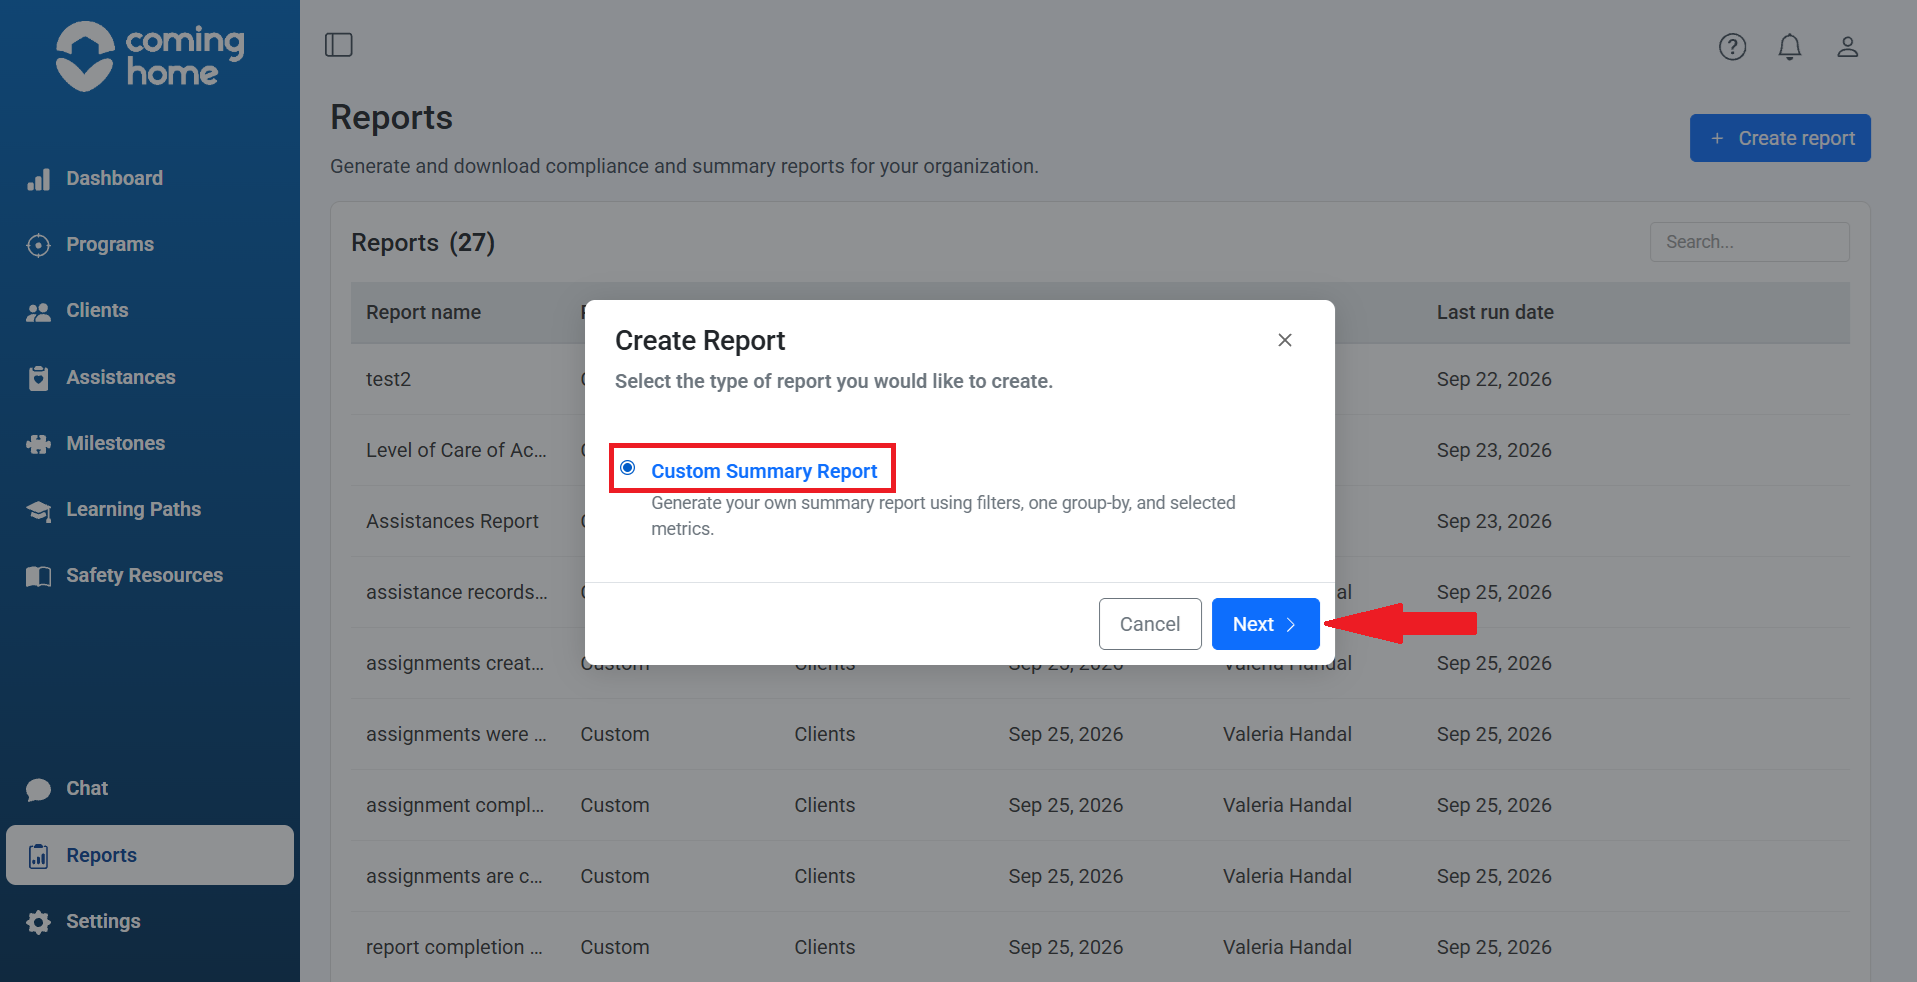
- Choose Custom Summary Report.
Step 2: Complete General Setup
Fill in the required fields.
Dataset: Select Assistances.
We're choosing Assistances because we want to measure recorded services and support.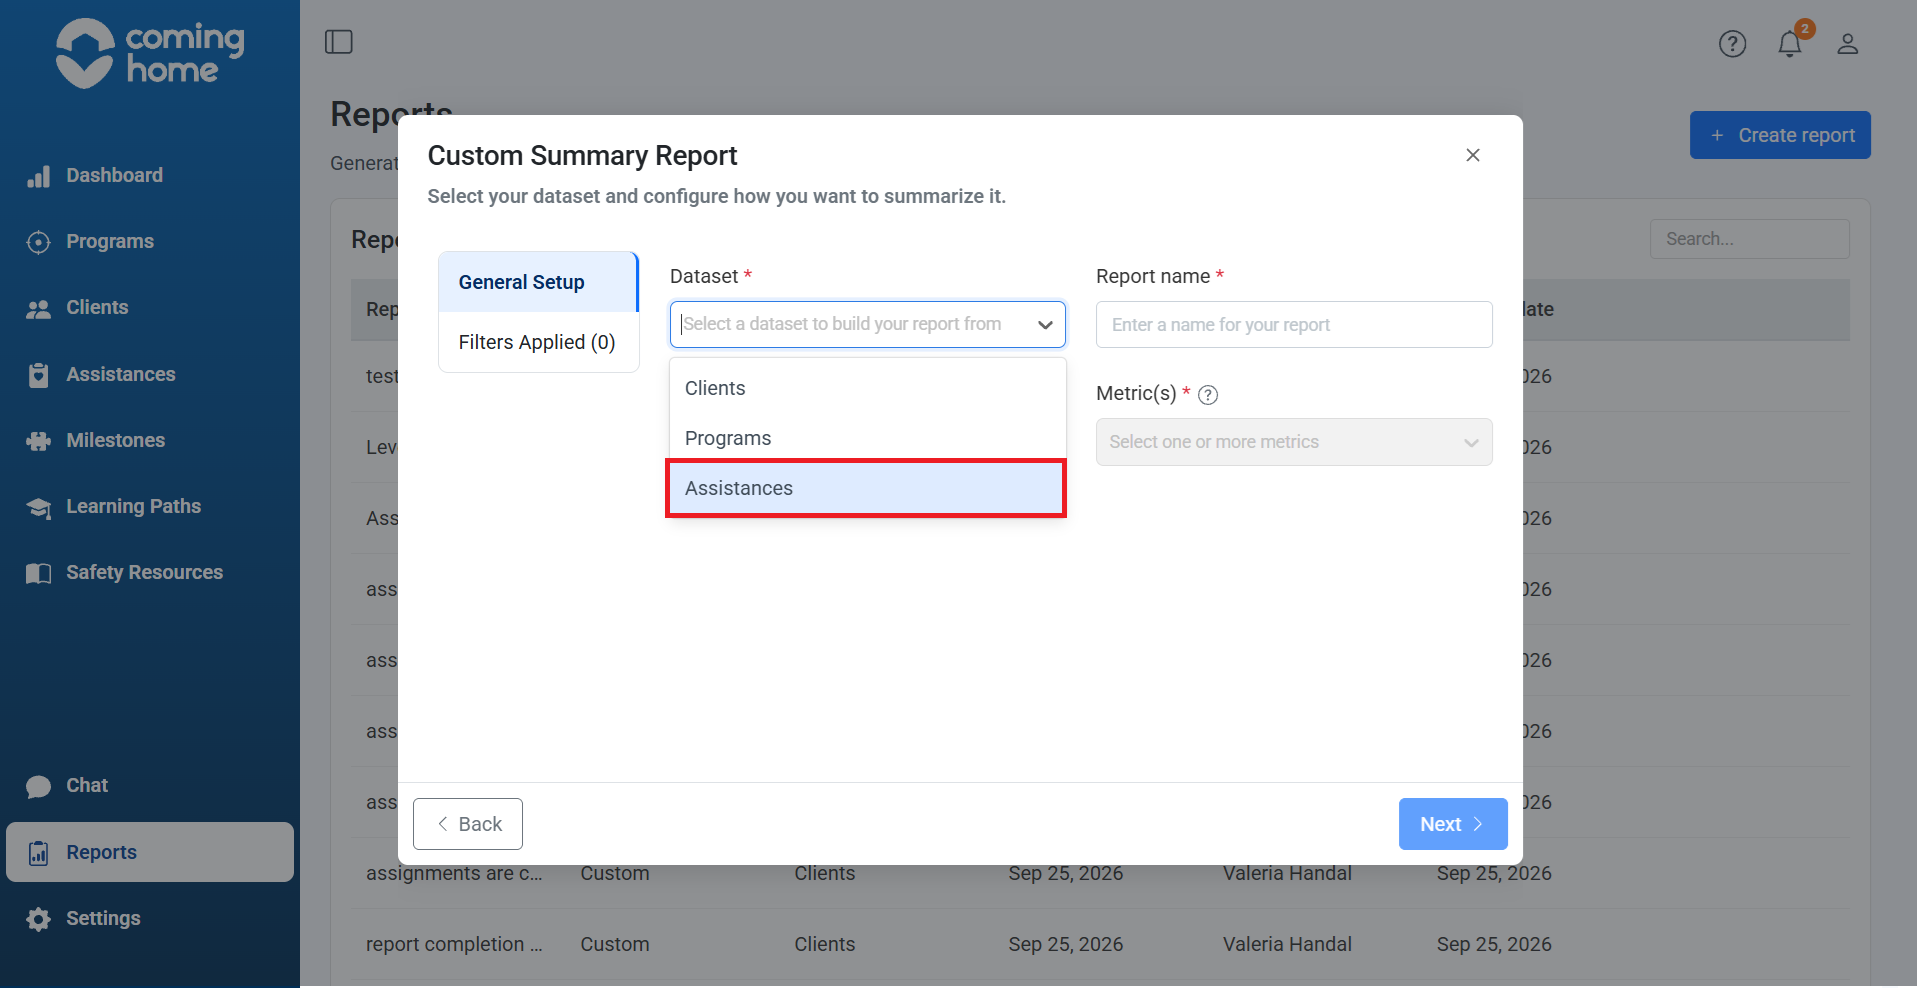
Report name: Enter a name that best describes your report (Example: Assistance Records by Distinct Client Type).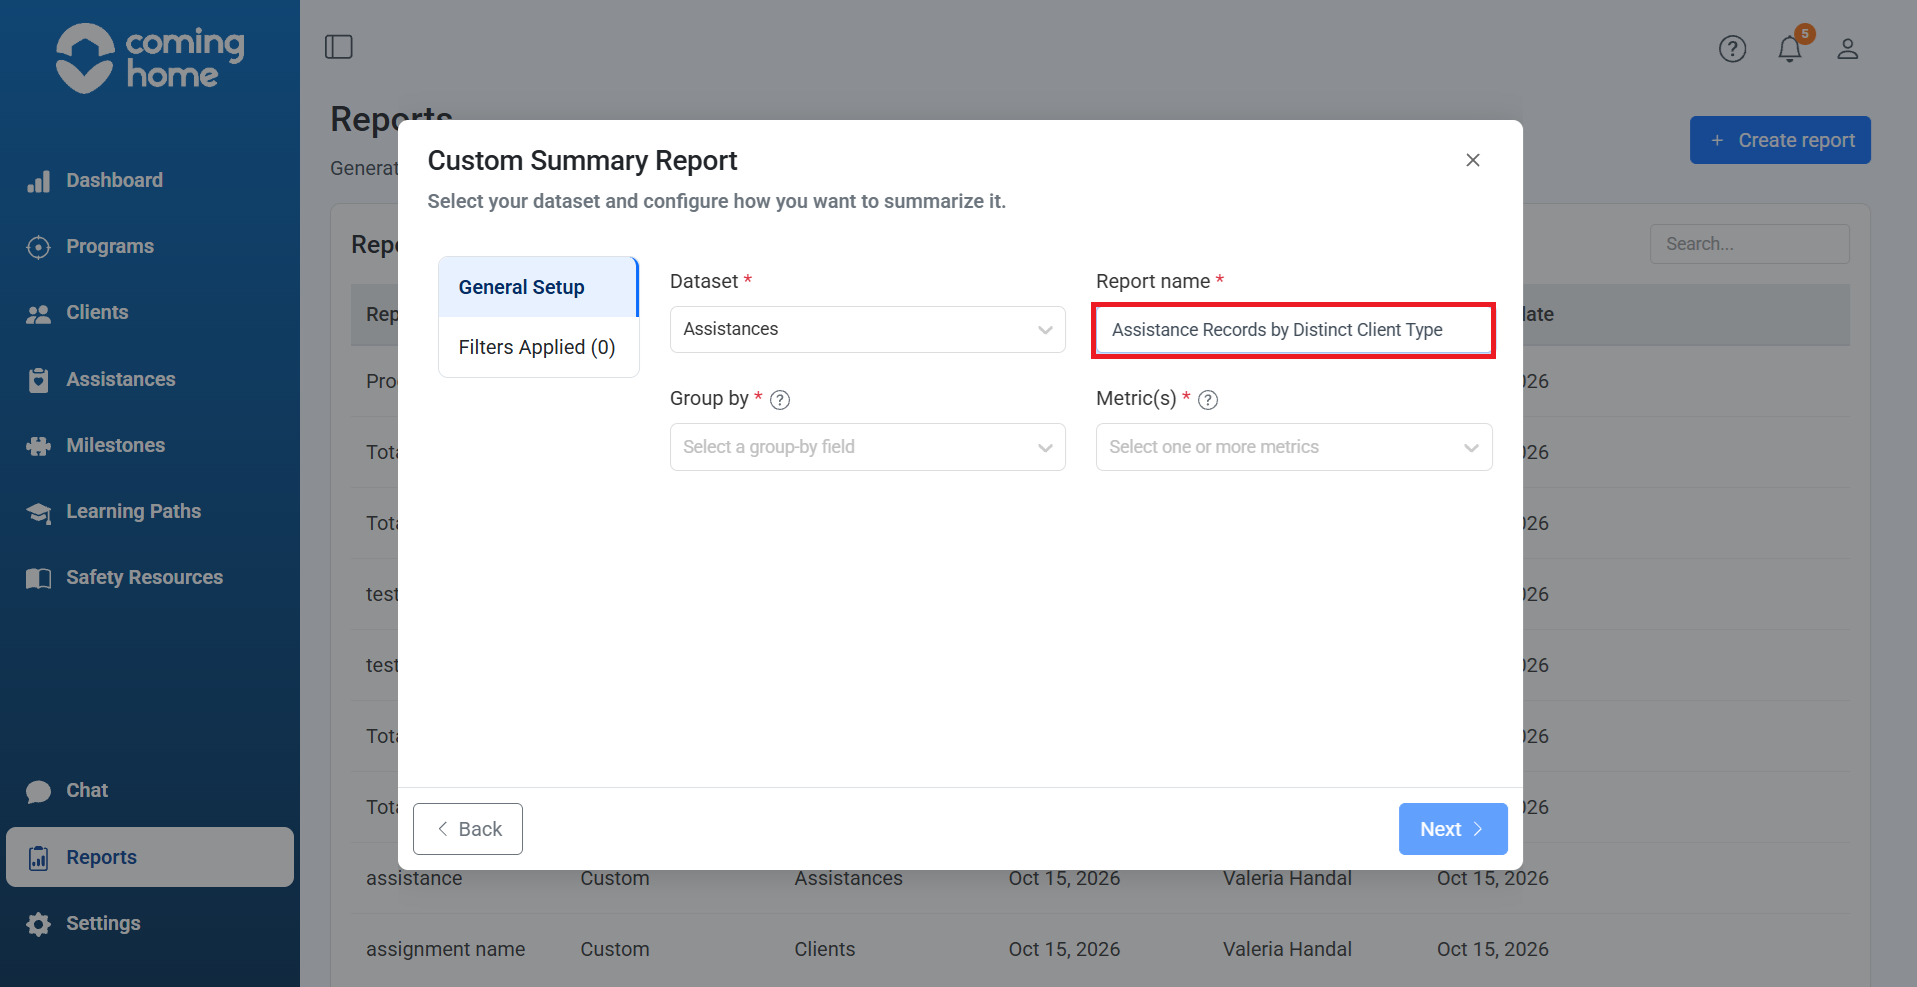
Group by: Select Assistance Type.
This organizes the results according to the type of Assistance provided.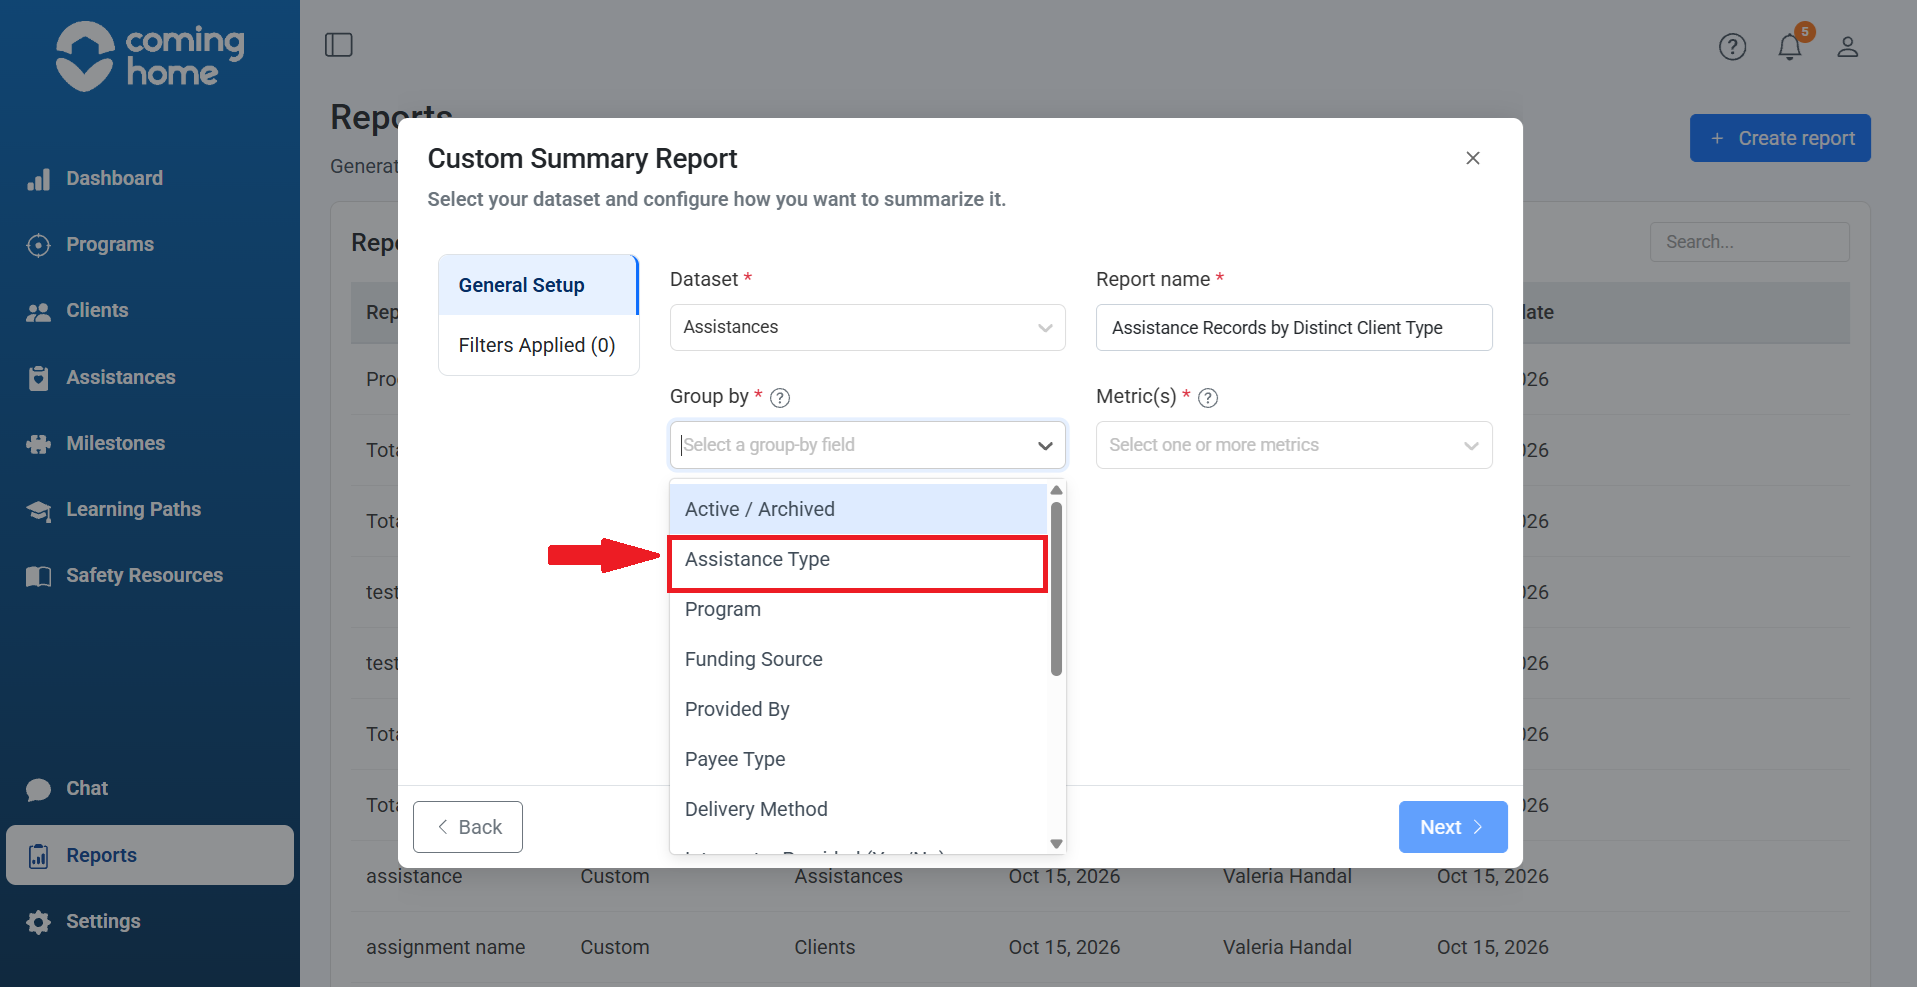
Metric(s): Select both:
- Total Assistance Records
- Total Distinct Clients
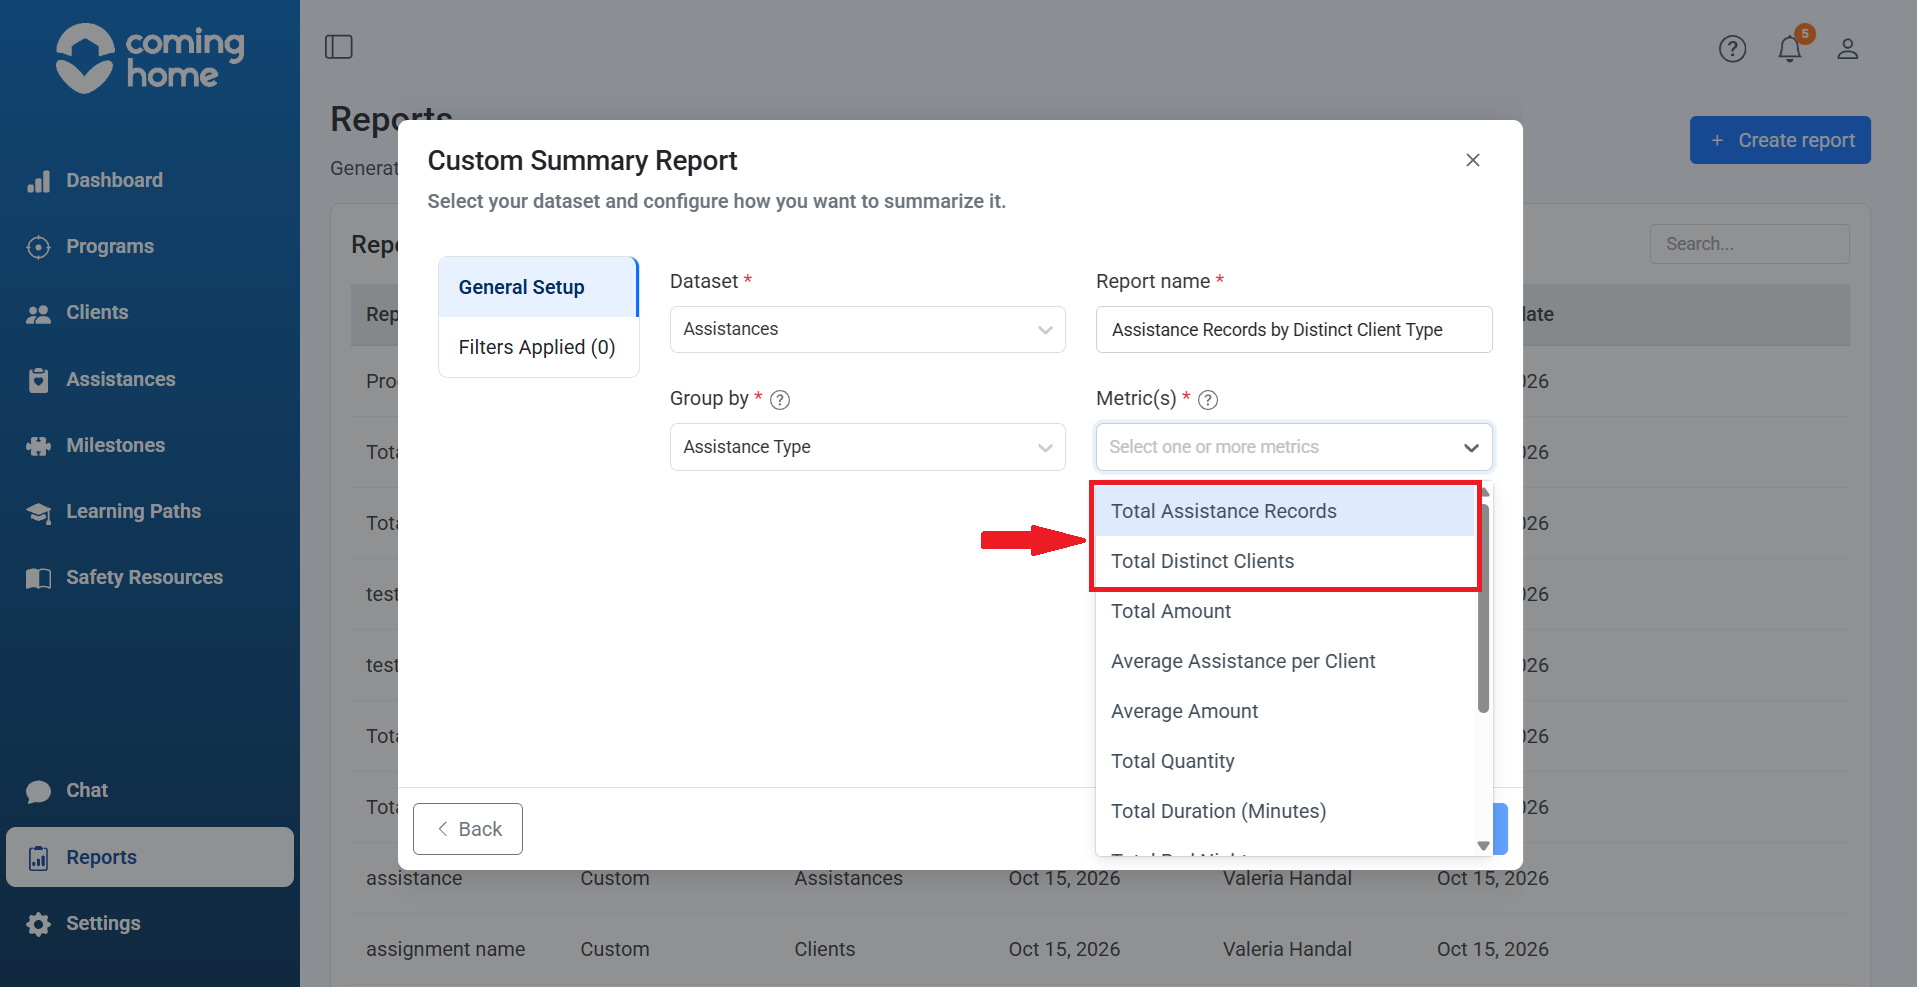
These metrics allow you to compare the number of recorded Assistances with the number of different clients receiving each type.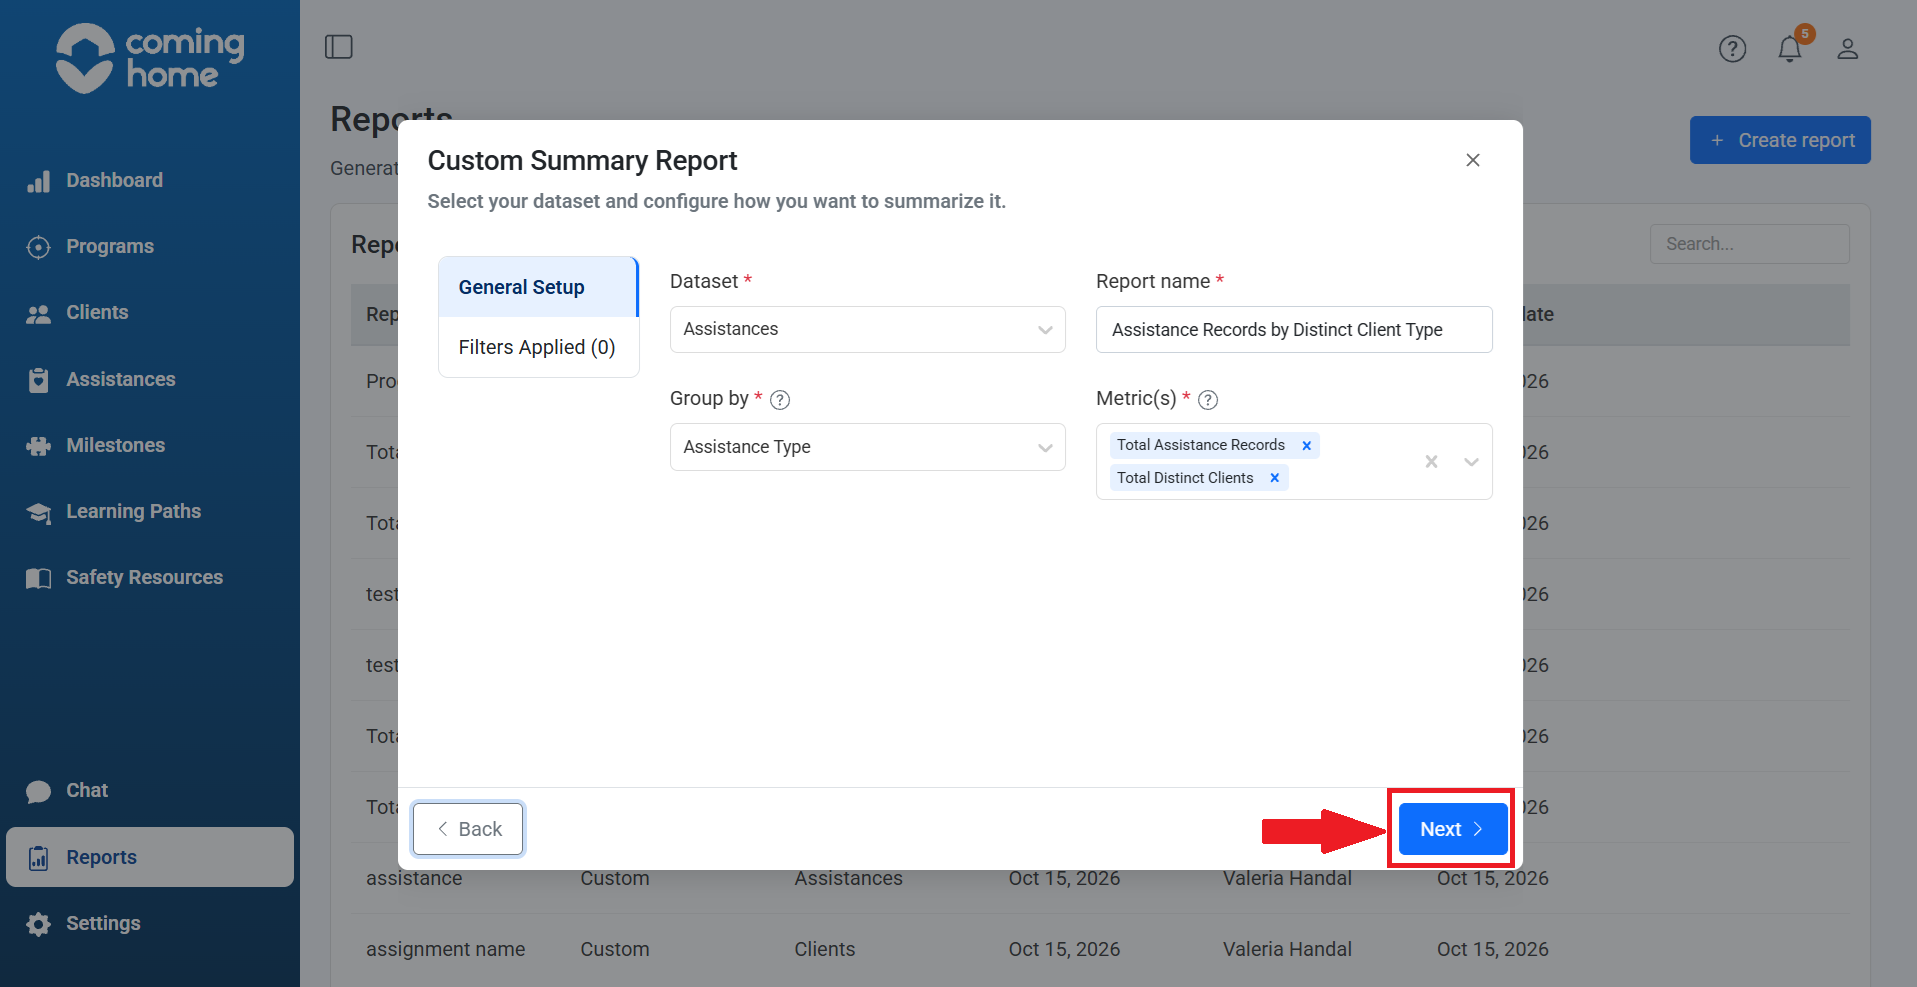
Once all four fields are complete, click Next.
Step 3: Configure Filters Applied
The next screen is Filters Applied.
For this example, we want our report to include all of our Assistances, so we'll leave the Filters section empty.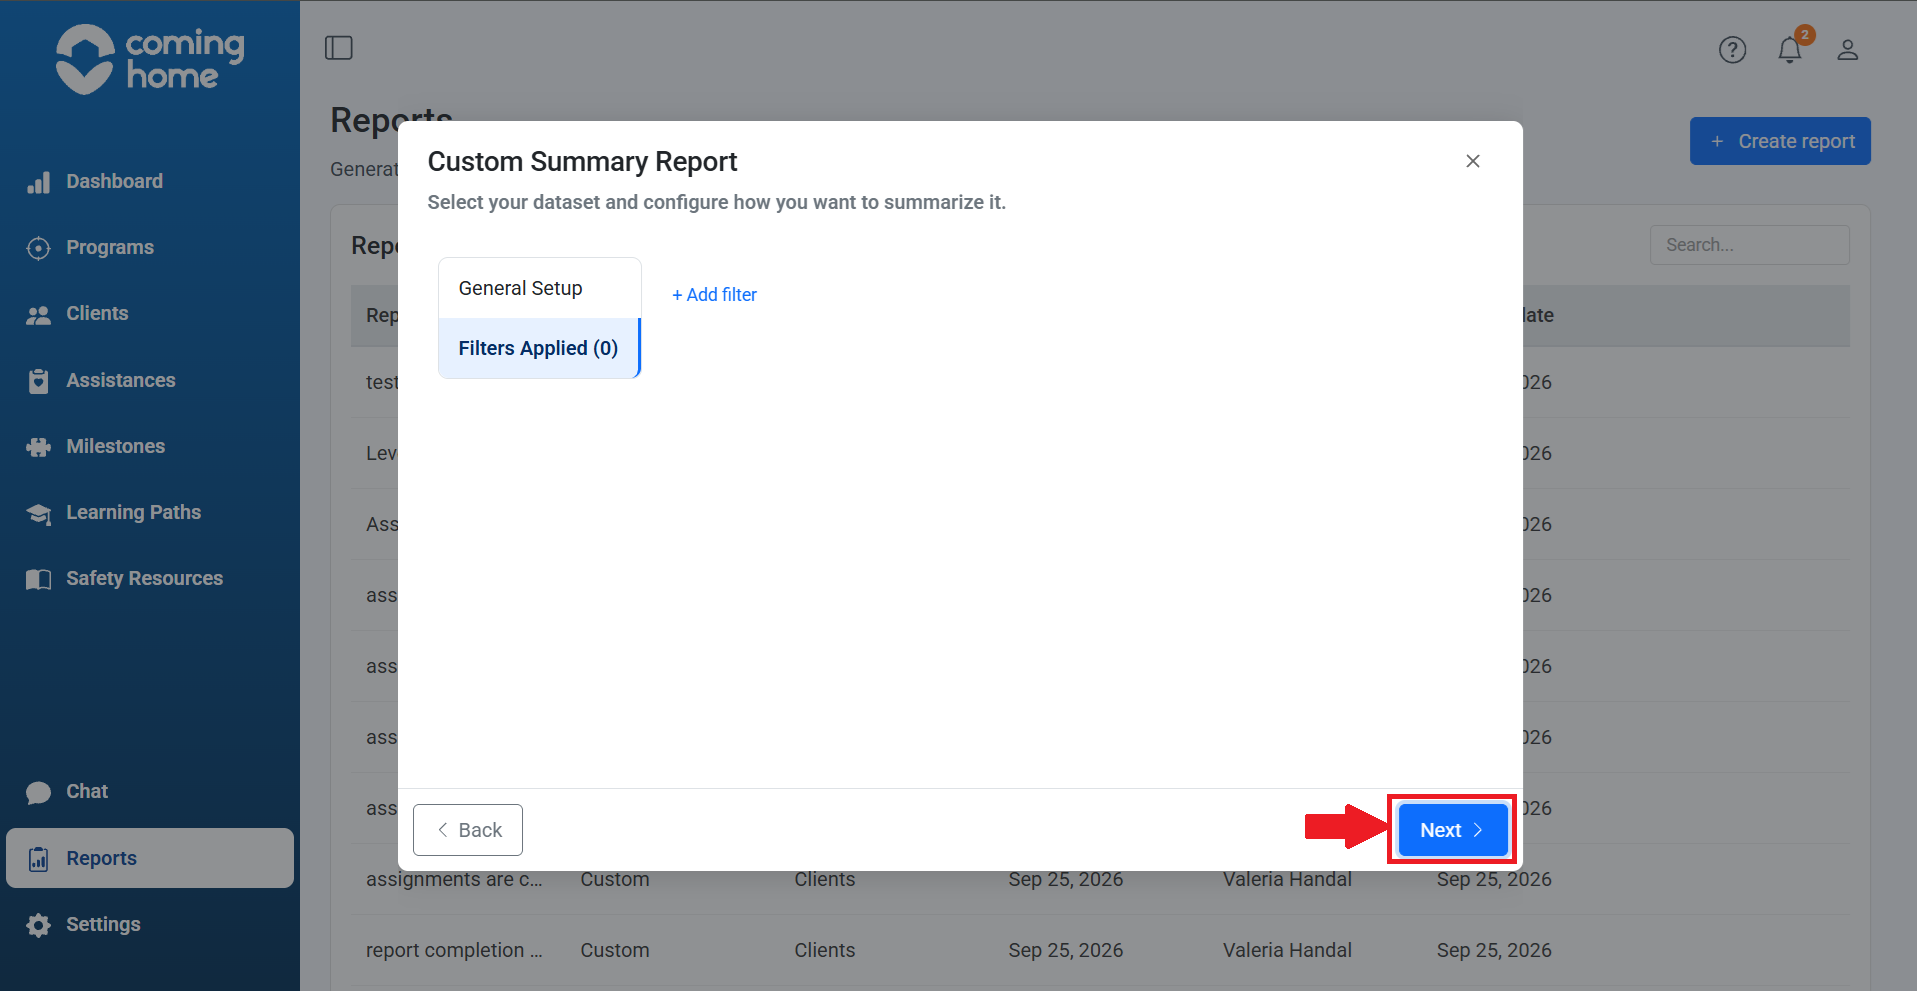
Click Next.
Step 4: Review Report Details
Confirm your report settings.
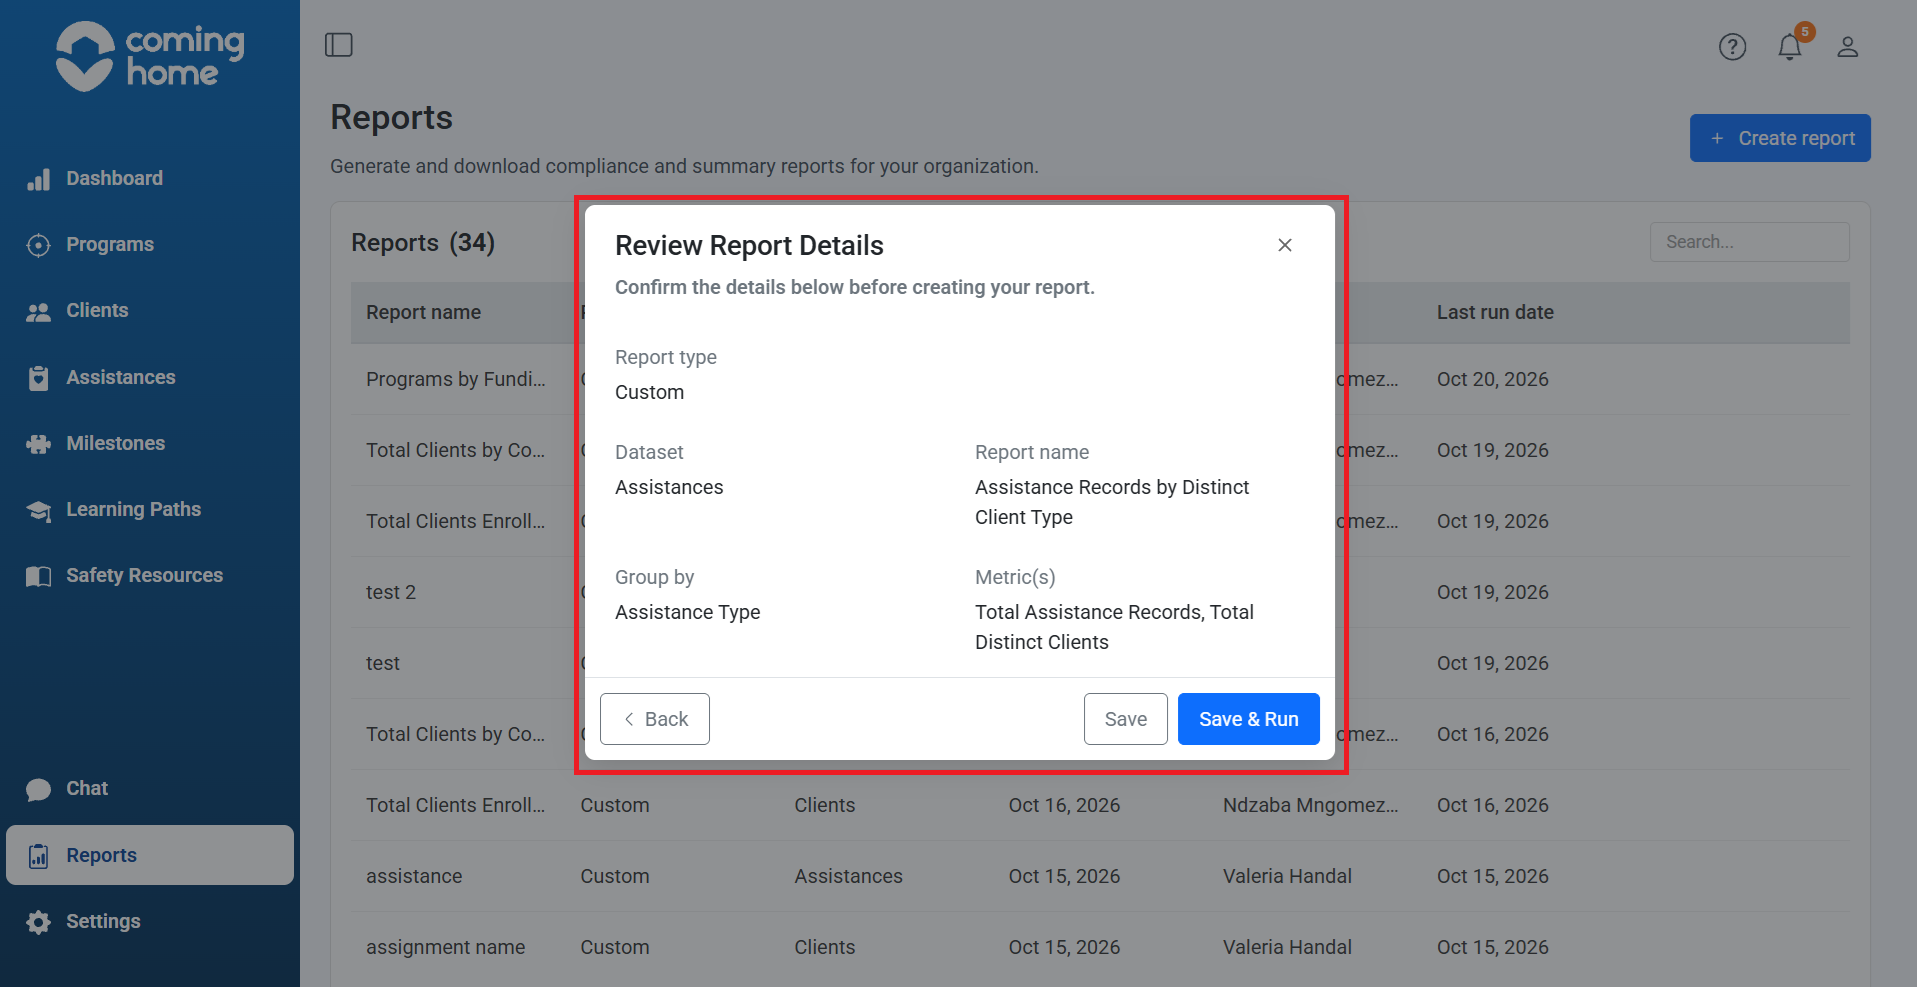
If everything is correct, continue.
Step 5: Save & Run
Click Save & Run.
Coming Home saves the report and automatically generates the results.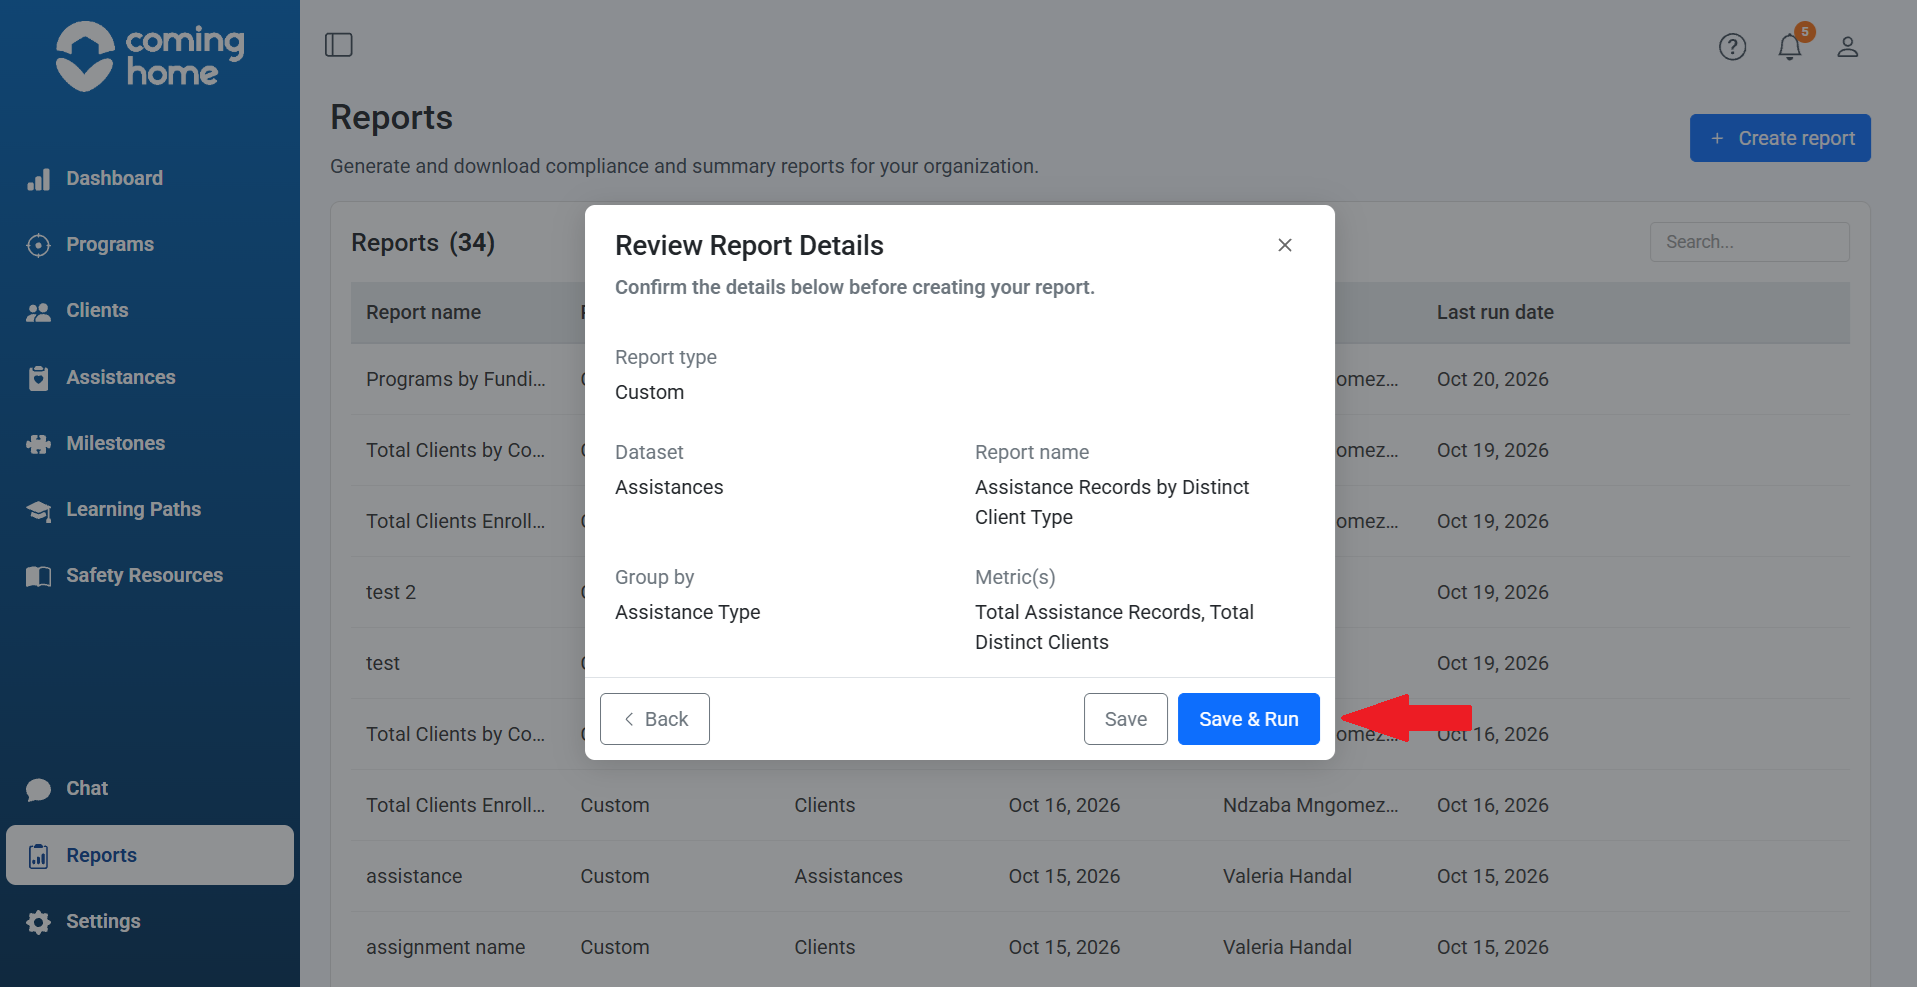
Step 6: Download your report
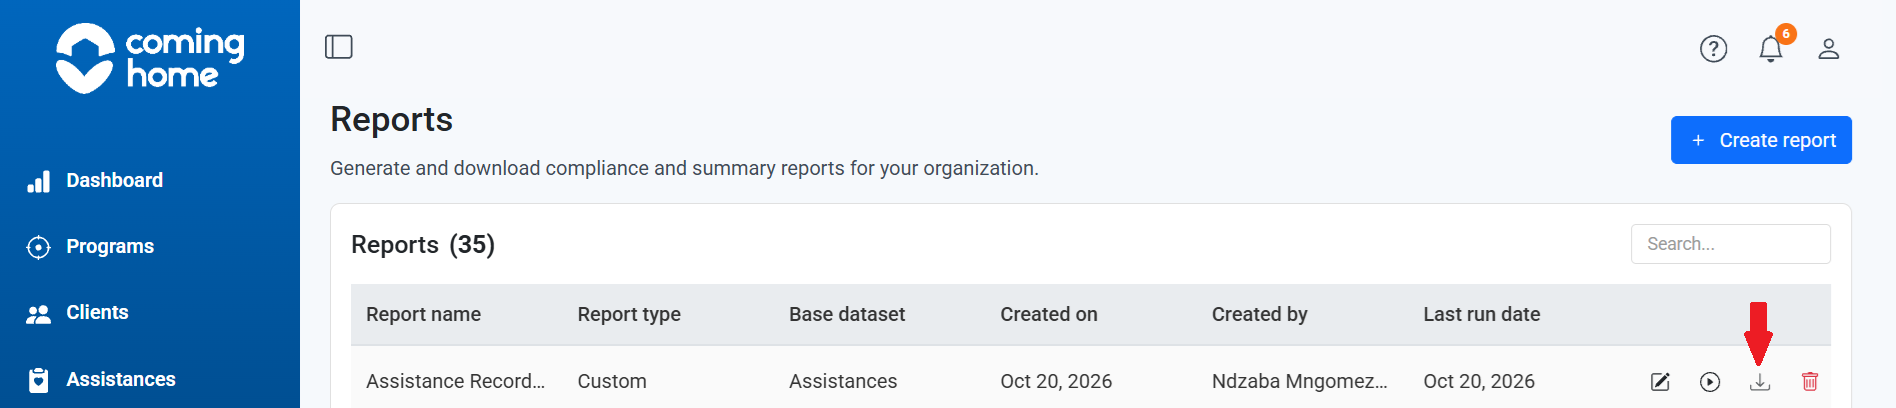
Hover your mouse cursor over your custom report to see the options menu for that report. Select  Download to retrieve the generated CSV file. The file will be downloaded to the Downloads folder on your computer, or wherever your browser downloads files by default.
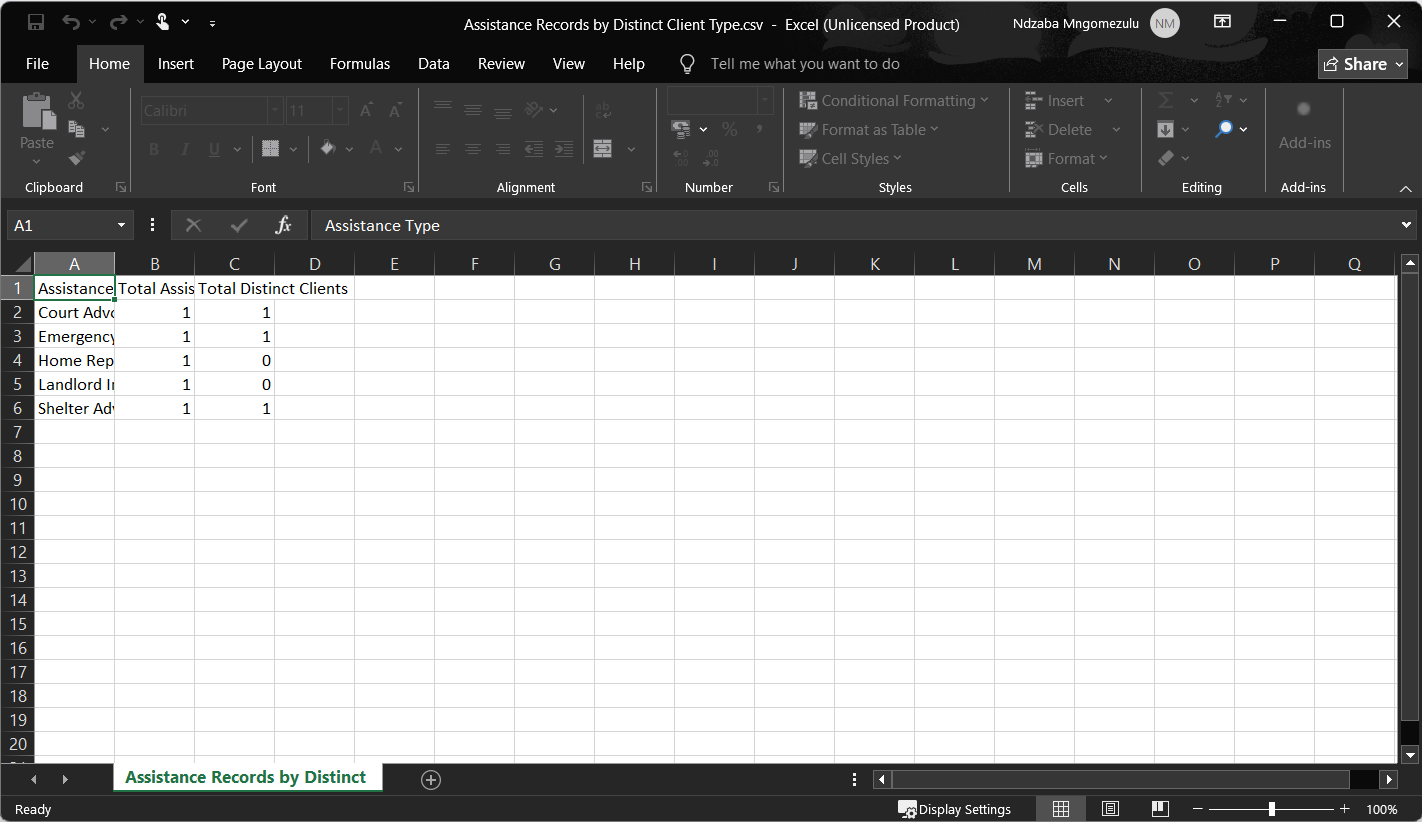
Your report will contain:
- Each Assistance Type represented in the matching records.
- The total number of Assistance records for each type.
- The number of distinct clients receiving each type.
What does this mean for your reporting?
Choosing the correct metric helps ensure your report answers the intended question.
For example:
"How many Assistances did we provide?" and "How many people received Assistance?" are different questions.
Use Total Assistance Records for the first and Total Distinct Clients for the second.
Related Articles
- What does “Group By” mean in Custom Reports?
- What filters can I use in Custom Reports?
- What datasets are available in Custom Reports?